
Case study: Using AI-enabled machine vision and load sensors to determine the optimal P80 for a real-life Australian mine
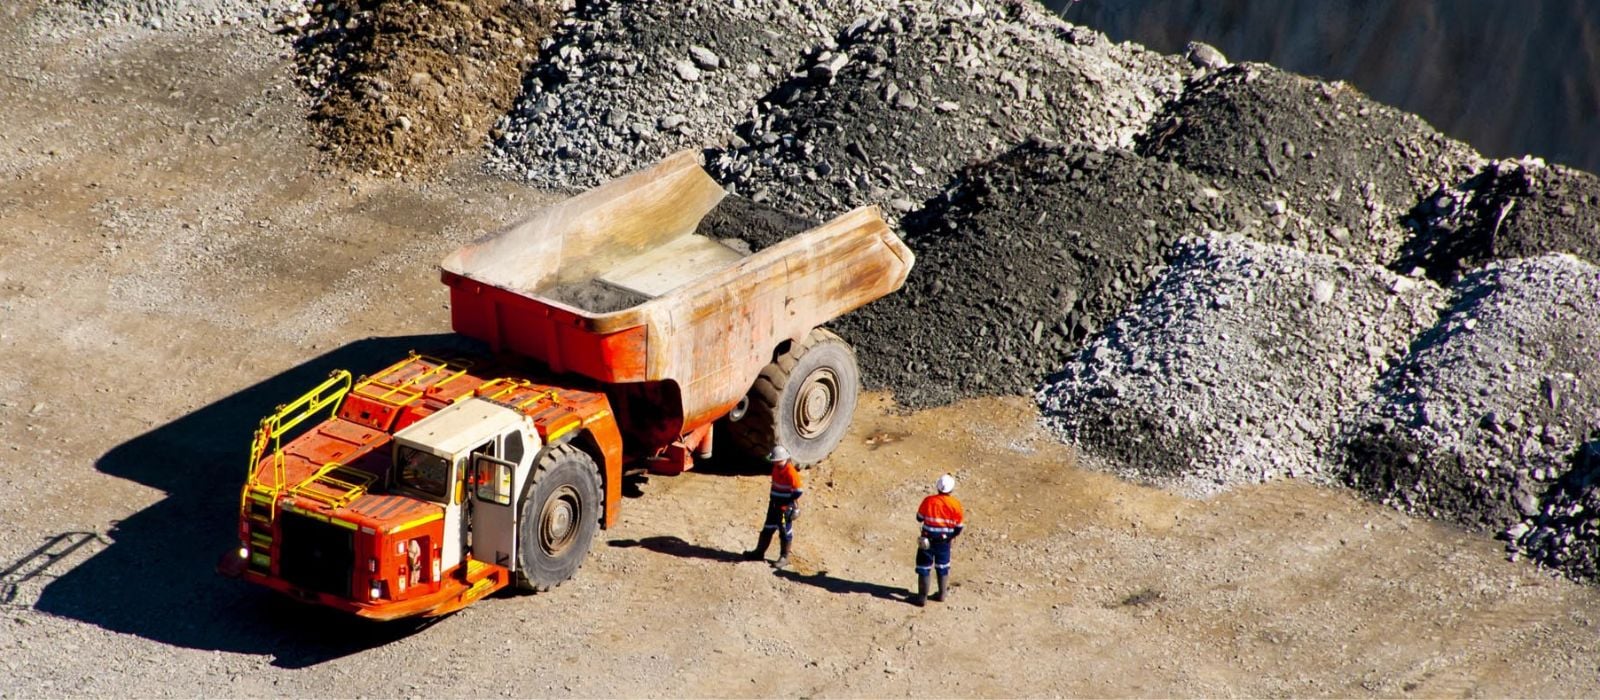
Shovels are essential units in modern hard rock mining applications, and maximising their productivity is key to achieving efficient load and haul operations.
However, they may not attain their full capacity when dealing with poorly fragmented rock. This would not only yield payload variations and operational uncertainty, but also increase energy consumption and maintenance costs. Therefore, it is critical to understand the relationship between the particle size and bucket payload to obtain optimal loading performance.
This study aims to provide a detailed method to optimise the loading performance of a hydraulic shovel through the utilization of AI-enabled machine vision, load, and motion sensors installed on a Hitachi EX3600B backhoe shovel.
In this study, data collected from ShovelMetricsTM Fragmentation and Payload Monitoring modules are synchronised based on timestamp proximity, and a data heat map was generated correlating particle size distribution with the bucket payload. Trends indicated that higher payloads consistently correlate with specific fragmentation ranges, which can be used to generate recommendations to optimise blast practices to maintain rock fragmentation within the identified range.
Results demonstrated that a 32-tonne bucket yielded its highest payload (ie, > 90 per cent bucket capacity) when the particle size was within the 15-25 cm range. In contrast, the same bucket achieved nearly 60 per cent of its capacity for fragmentation sizes passing 32 cm and more.
As a result, this study emphasised the relationship between the particle size distribution and shovel bucket payload via the integration of real-time fragmentation and payload assessment using AI-enabled machine vision and sensor-based measurements.
Introduction
Rock fragmentation by blasting is one of the most essential steps of hard rock mining. Fragmentation allows rock to be mobilised for loading and hauling processes and further processed in enrichment facilities. However, managing the correct particle size is difficult, as numerous uncontrolled physical factors might impact the blast's performance. Although the correct particle size is not universal and might change from mine to mine, there is usually a ‘sweet spot’ for each operation, depending on factors like dipper size and loading unit size, crusher specifications, etc as highlighted by Nikkah et al. Finding this suitable level of fragmentation enhances the performance of loading and hauling operations and diminishes the associated costs (Nikkah et al, 2022).
One of the primary factors that would be impacted by the suboptimal particle size in load-haul operations would be bucket and truck fill factors. For example, Beyglou et al found that for different classes of particle sizes, the bucket fill factor displayed a gradual decrease as it yielded coarser material (Beyglou et al, 2017). Another critical factor that the poor blast quality would impact would be material diggability. As cited in Khorzoughi’s work, the digging rate of the loading equipment is inversely proportional to the material coarseness in the muck pile (Jimeno et al, 1995, as cited in Khorzoughi, 2017). Another similar study by Jethro et al has uncovered that as the mean fragment size grows, the digging time grows along with a high correlation (Jethro et al, 2016).
Another important parameter to monitor after each blast is the uniformity index of the blast. The uniformity index is often considered an indicator of the distribution characteristics of the pile, meaning how tendent the particles are to display a uniform size distribution, or, in other words, how spread the size range is within the pile. Singh realised that the void space generated between particles in a pile strongly relates to this uniformity index, indicating that the percentage of voids increases sharply with increasing uniformity index along with stickiness of particles (Singh, 2006).
In another study, Dotto reviews several sources indicating shovel productivity is directly related to uniformity index and fragmentation size. He points out that good blasting would yield higher pile density and better loading efficiency at the operational level (Tosun et al 2012, as cited in Dotto et al, 2018). Finally, another important study conducted in the Porgera mine by Cottee has indicated that with improved fragmentation in a series of 3 trial cases, the truck payload was increased by 10 per cent. In contrast, the digger time was reduced by 36 per cent, indicating an overall 12 per cent reduction in load-haul operations of the mine (Cottee, 2001).
Accordingly, this study aims to investigate the optimal 80 per cent passing size (also called P80) in a real-life Australian mine by using a sensor-based payload monitoring system and an AI-enabled camera system to monitor the corresponding particle size distribution. The study has shown an optimal particle size for this loader, as the most optimal results have pointed to a specific P80 range for this operation. The name of the mine was kept anonymous in this paper for confidentiality reasons.
Methodology
ShovelMetrics Gen3, equipped with a Payload Monitoring (PLM) system from Weir Motion Metrics, was used as the main toolset in this study. This system offers several capabilities, including fragmentation monitoring based on image processing and bucket payload monitoring from different sensors installed on the shovel. The data is collected and processed on EDGE computing systems and then sent to the cloud for further processing. The following images demonstrate some of the close-up shots from the installation process.
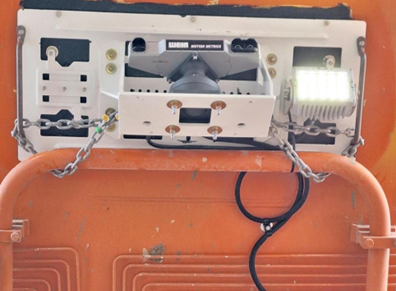
Figure 1. Bucket camera.
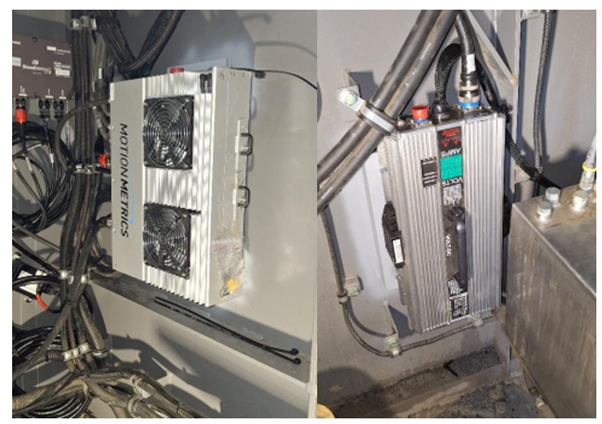
Figure 2. CPU and power supply.
The PLM system comprises orientation sensors and pressure sensors to deduce the bucket payload of the shovel. These sensors are installed on strategic locations on the shovel to provide seamless sensory data to be evaluated by the CORE processor. See Figure 3 for installation locations.
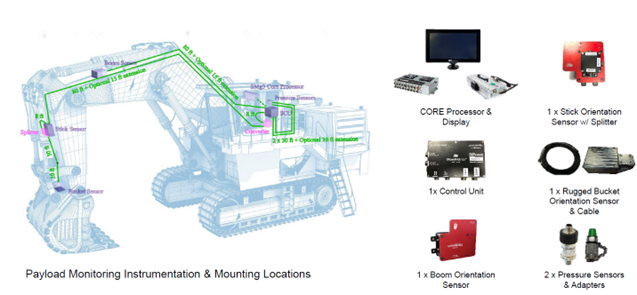
Figure 3. Payload monitoring instrumentation and mounting locations.
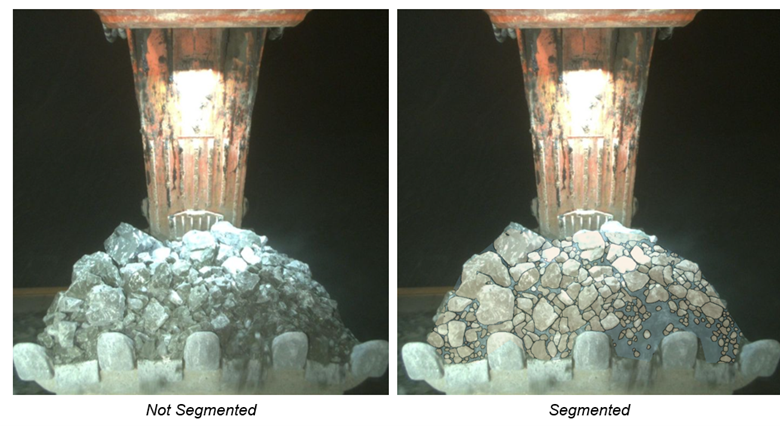
On the other hand, the bucket camera is positioned to see the shovel bucket, grab material images for each pass, and send signals to the cloud for analysis. As a result, it provides a complete particle size analysis via image processing. The information is then stored on the cloud with distribution characteristics and corresponding timestamps. Figure 4 shows a sample image collected from this shovel.
Once the data is gathered, the data from each sensor is merged based on timestamp proximity to capture the best correspondence between events. Accordingly, 6 weeks’ worth of data were collected from these sensors and analysed based on the P80 relationship concerning the three main productivity parameters: digging duration, cycle time, and payload achieved.
Data merging and processing
Data was collected from different sources, so a data merging process was required to synchronise the corresponding events. For this purpose, a Python-based data pipeline was built. Data mergers are constructed in multiple ways. The fleet management system data was also used to identify loading locations, blast polygons, dumping locations, and truck haul cycles. This information is then used to identify the best-performing locations regarding blast performance. However, this paper focuses only on the particle size payload relationship. The events logged by different sensors are then merged into a master dataset. Timestamps are matched within a 1-minute proximity window. As another set of key connectors, equipment identifications are used during the merging process to ensure the collected data is coupled with the correct information and equipment. A diagram of the constructed data pipeline can be observed in Figure 5 below.
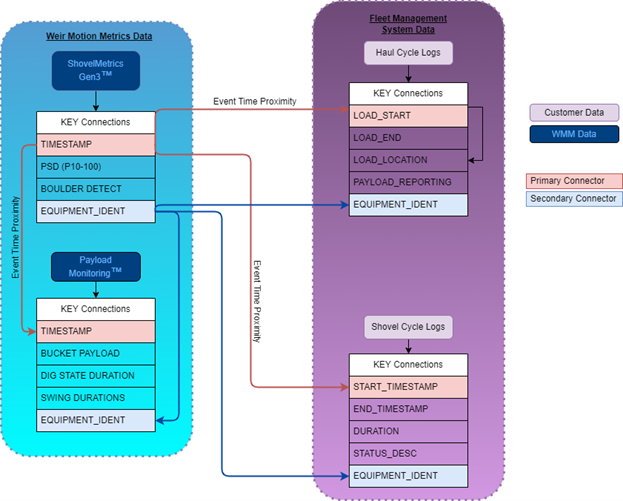
Figure 5. Data processing and merger pipeline.
Results and discussion
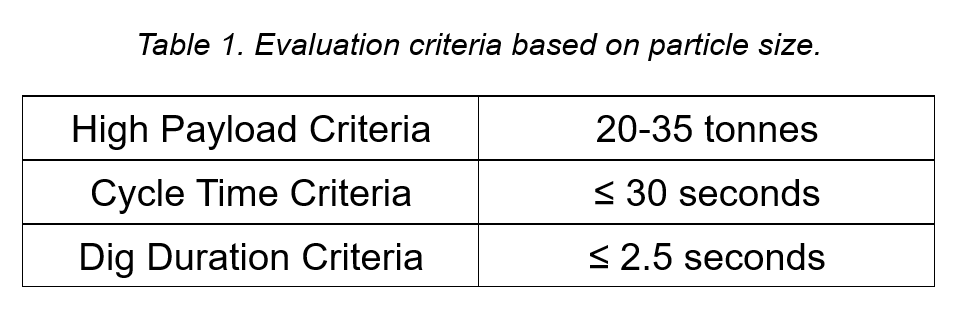
The following thresholds were set to test the performance based on particle size to see the data distribution corresponding to the optimal particle size. Any events in this range were accepted as a ‘good’ performance. Please note that this test is conducted at a dipper capacity of 35 tonnes.
Once the data was prepared, histograms were generated to see the clustering of the field data concerning particle size ranges. The following figures show that the data was mainly centred around a 20-25 cm bin, pointing to a range for optimisation.
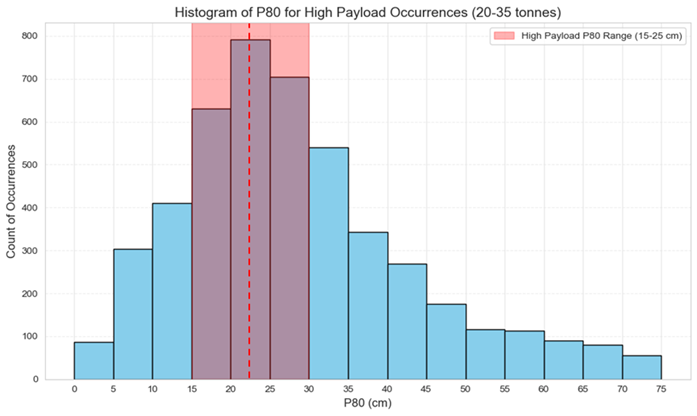
Figure 6. Field payload data distribution.
Payload data distribution indicates that the shovel attained the highest loads when the particle size is around a 20-25 cm particle size range. When data was binned into increments of two for payload correlation, the results showed a corresponding correlation between decreasing median P80 (cm) and increasing payload values.
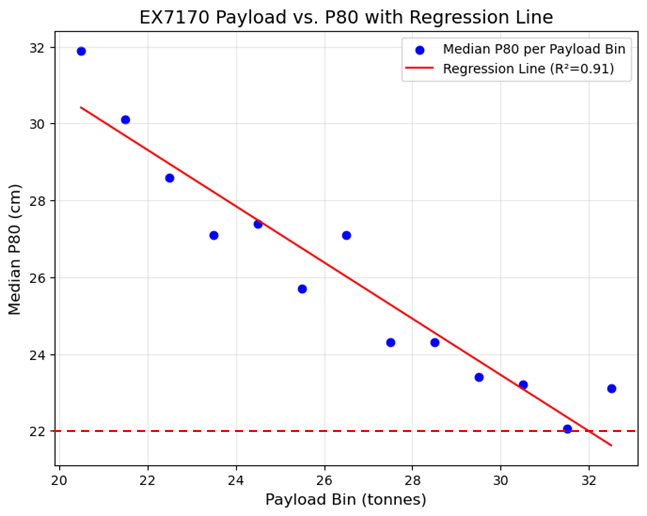
Figure 7. Field payload data vs. particle size distribution.
This relationship shows that much better bucket filling is achieved when the particle size approaches ~22 cm range. See the following figures for examples of high and low payload cases and their corresponding P80 values.
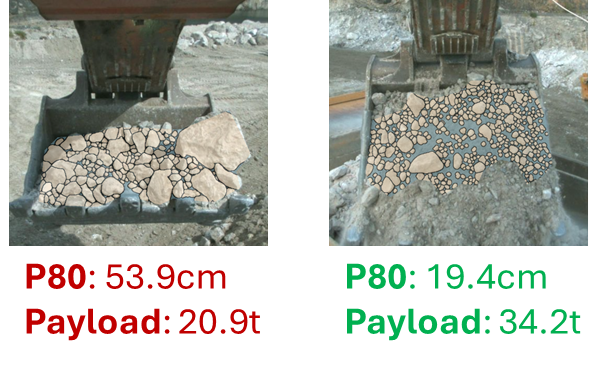
Figure 8. High payload vs. low payload example.
When a similar analysis was conducted on the cycle time, the histograms displayed a similar tendency towards the optimal particle size distribution. However, the relative correlation between cycle time, dig duration, and P80 size was relatively weaker than the payload values. This might be associated with the noise in the data or other factors (ie, operator factors, boulder presence, and other factors like bench cleaning).
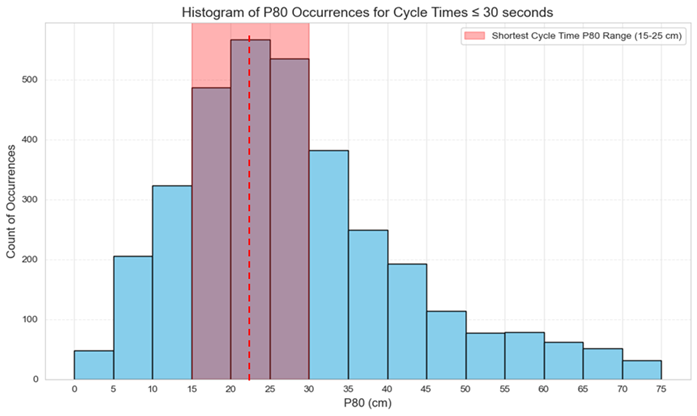
Figure 9. Field cycle time data distribution.
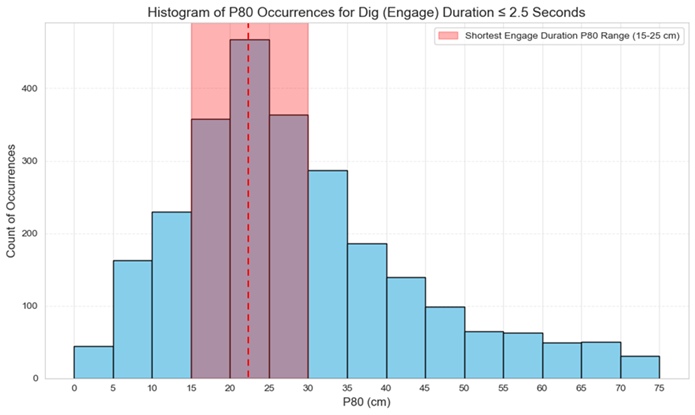
Figure 10. Field dig duration data distribution.
The other histograms also show that the collected sensor data is clustered around a similar particle size range, as it was for payload, indicating a possible optimal point for this shovel operation at this dipper capacity. Please note that this study does not include the impact that might be caused by the operating techniques applied by different operators; however, the indicated size range was prominently seen as consistent with the mine’s loading performance for the given time range at the given P80 sizes.
Conclusion
It is widely believed that optimal fragmentation positively impacts shovel productivity. Earlier studies have shown a strong relationship between optimal particle sizing during blast operations and improved productivity metrics. This study investigated real-life hydraulic shovel performance with AI-enabled machine vision and payload sensor technology to collect operational data. The data analysis has pointed out an operational tendency indicating a particular size range in the shovel performance over 6 weeks. The data collected was merged based on the timestamps of the logs and associated based on the event time proximity. Data distribution has shown that the shovel attained high performance metrics when the particle size is within the 15-25 cm range, indicating a high confidence for targeting an optimal P80 size for the highest performance for the blast design.
References
Babaei Khorzoughi, M. (2017). A study of electric rope shovel digging effort and behaviour for diggability assessment in open pit mines (T). University of British Columbia. Retrieved from https://open.library.ubc.ca/collections/ubctheses/24/items/1.0343457
Beyglou, A. & Johansson, Daniel & Srhunnesson, H.. (2017). Target fragmentation for efficient loading and crushing -The Aitik case. Journal of the Southern African Institute of Mining and Metallurgy. 117. 1053-1062. 10.17159/2411-9717/2017/v117n11a10.
Cottee, S. (2001). Impact of fragmentation on truck and loader productivity. B.Sc Thesis, School of Engineering, The University of Queensland.
Dotto, M. S., & Pourrahimian, Y. (2018). Effects of fragmentation size distribution on truck-shovel productivity. MOL Report Nine, 335-342.
Jethro, Michael & Shehu, Shaib Abdulazeez & Kayode, Saka. (2016). Effect of Fragmentation on Loading at Obajana Cement Company Plc, Nigeria. International Journal of Scientific and Engineering Research. 7.
Nikkhah, A., Vakylabad, A. B., Hassanzadeh, A., Niedoba, T., & Surowiak, A. (2022). An Evaluation on the Impact of Ore Fragmented by Blasting on Mining Performance. Minerals, 12(2), 258. https://doi.org/10.3390/min12020258
Singh, Sp & Narendrula, R.. (2006). Factors affecting the productivity of loaders in surface mines. International Journal of Surface Mining. Reclamation and Environment. 20-32. 10.1080/13895260500261574.