


Case study: Is your flotation circuit using the air you give it?

Natasha Walter, Senior Technical Specialist, and Kenneth Lee, Group Metallurgist – Kemtec Mineral Processing
The hidden variable in flotation performance
Operators rely heavily on experience to monitor flotation plant performance, checking air rates, reagent dosages, operating trends and the visual appearance of the froth. This reactive control based on lagging indicators can lead to inconsistent performance and decreased recovery.
Whilst air addition tells operators how much air is supplied to a flotation cell, it does not translate to how much of that air is being effectively dispersed and retained as usable air. Gas hold-up (Ɛg) is the volumetric fraction of air retained within the pulp. Because it reflects the combined effects of air addition, bubble size, frother concentration, slurry conditions and equipment performance, it provides a practical indication on how the flotation cell is effectively converting the inputs into productive flotation conditions.
In this article, we discuss an application of FlotSense® and the technology behind how we can use flotation hydrodynamics to estimate the rate of flotation occurring within individual cells and the circuit as a whole. This information helps translate flotation fundamentals and the decisions that influence recovery, selectivity and circuit stability, which can then be used to optimise both reagent strategies and operating parameters to create the conditions needed to achieve the desired circuit performance.
Finding your operating window
Through instantaneous and continuous measurement of gas hold-up in the circuit, operating windows defined by your specific ore, processing conditions and performance targets can be developed. At an Australian polymetallic operation, a preliminary hydrodynamic survey of the circuit was undertaken to investigate performance constraints within the flotation circuit.
The survey identified a sharp contrast between rougher and cleaner duties. The rougher and scavenger banks were operating at comparatively low superficial gas velocities, while the cleaner circuit was operating at much higher air intensity. No dedicated frother was being applied to the circuit at the time, and the cleaner froth was visibly dense, viscous and slow moving.
Direct gas hold-up measurements and lip samples were collected as air and reagent addition was systematically varied. The addition of frother to the rougher circuit immediately improved the hydrodynamic performance of the cells, with gas hold-up values increasing and froth mobility improving. The previously tenacious froth became more mobile and no longer overflowed the concentrate launders. In the cleaner circuit, however, the results demonstrated that increasing air did not automatically improve performance. As gas hold-up increased past a certain point, concentrate grade declined (Figure 1), showing that excessive aeration was increasing mass pull and entrainment at the expense of selectivity. Through the assessment, a clearly defined operating hydrodynamic profile was developed, and by re-balancing the air in the circuit so that each cell was operating within the hydrodynamic range suited to its metallurgical duty, recovery and selectivity were improved simultaneously.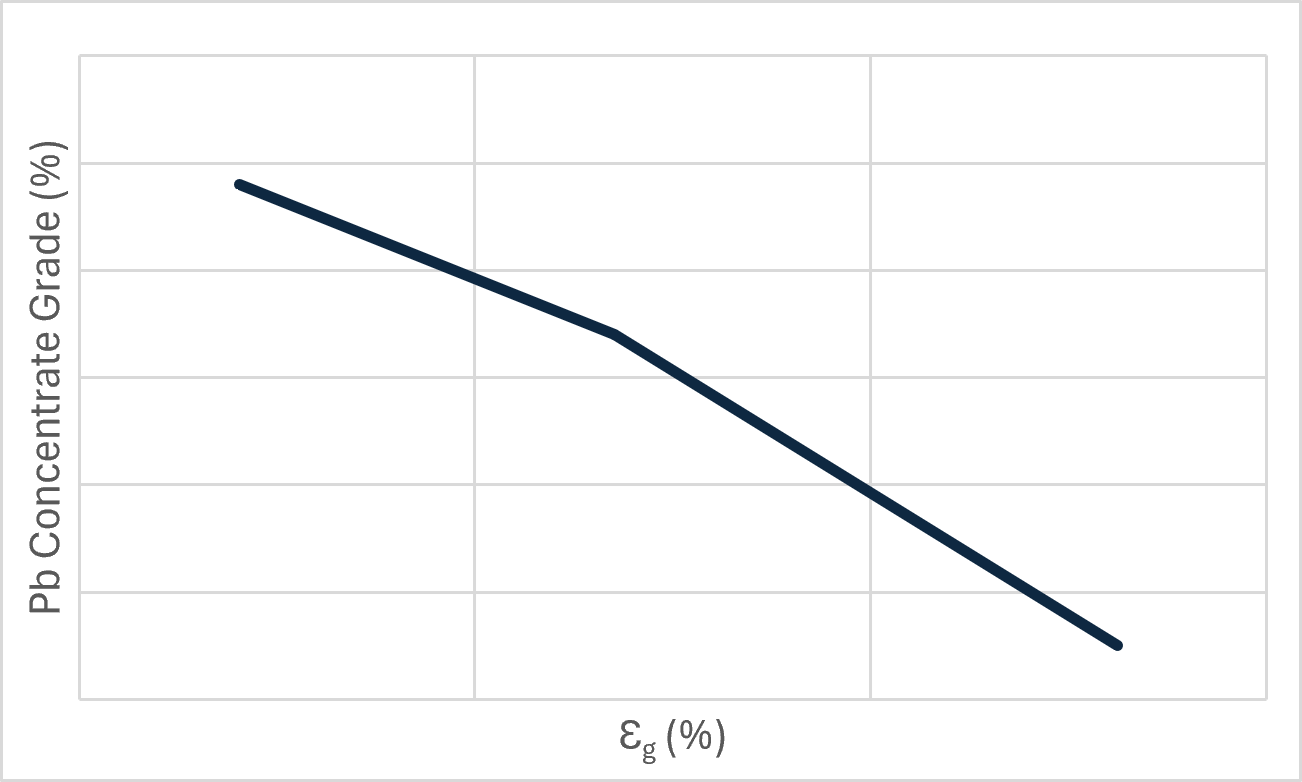
FIG 1 - Ɛg - Concentrate grade relationship
Air rate ≠ Usable air
Increasing air rate can increase available bubble surface area, but only if the air is effectively dispersed. Beyond an optimum point, unwanted bubble coalescence, water recovery and fine gangue entrainment increase.
The distinction between air supplied and usable air is important in identifying issues within the circuit. Cells operating at identical air addition may have distinct gas hold-up values (Figure 2). Frother availability, slurry density, mechanical condition and air dispersion all influence the amount of usable air retained in the pulp. Measuring gas hold-up makes these differences visible and provides a targeted basis for adjusting air distribution, frother strategy or maintenance priorities.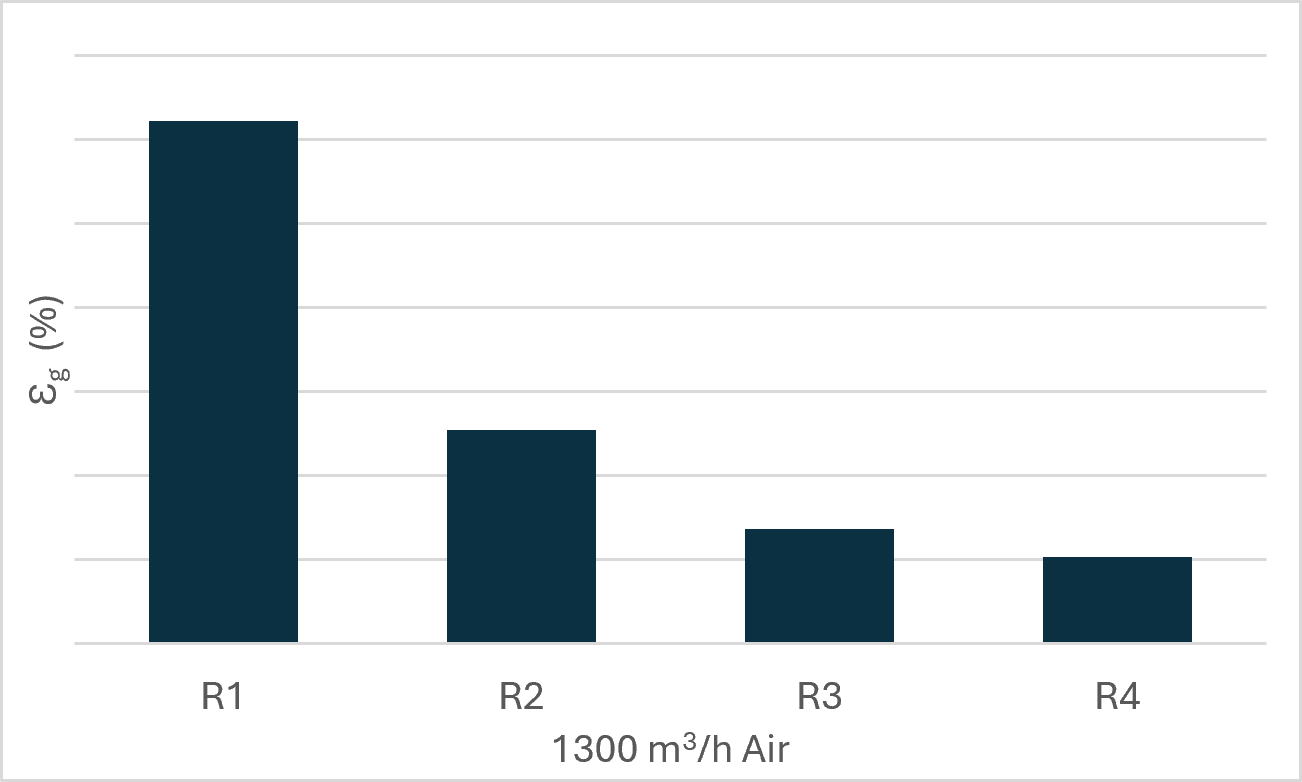
FIG 2 - Ɛg profile of bank
Plant survey to operating strategy
Site-specific gas hold-up profiles can support recovery and selectivity targets, reveal uneven utilisation of installed flotation volume and help distinguish reagent limitations from mechanical or operational constraints. This enables operations to optimise existing assets