
Perspectives on the long-term outlook for iron ore

This article was first published in the Bulletin in 2015. It was originally delivered as a keynote presentation as part of the Iron Ore 2015 conference, held in Perth from 13-15 July.
Abstract
World demand for iron ore is far from peaking, and the substantial price decline that has captivated commentators since early 2014 is not the result of widespread misreading by producers of the prospects for global market growth. Recent price movements provide little useful insight into the industry’s longer-term fortunes, apart from reminding mining companies that their businesses need to be robust against the volatility and inescapable cyclicality of mineral commodity markets. It is timely to take a strategic view of the history and longer-term prospects for the iron ore industry, and of Australia’s place in it.
A long-term view
Over the last century, the world’s annual crude steel production has grown from around 60 Mt to more than 1.6 Bt in each of the last two years. This growth has been far from uniform, being concentrated in two key periods – the 35 years after World War II and the China-driven boom since 2000. For the period from 2000 to 2010, the compound annual growth rate of China’s steel output at 17.4 per cent sits in stark contrast to the paltry 1.0 per cent per year posted by the rest of the world.
Figure 1 charts the evolution of global steel production since 1910. The extraordinary growth spurt since the dawn of the 21st century is immediately obvious, but the interruption to the recent upward path triggered by the global financial crisis and the sharp v-shaped recovery that followed are also of interest.
While the drop in absolute annual tonnage from 2008 to 2009 was more than in the Great Depression of the 1930s (105 Mt versus 70 Mt), it came off a base 11 times higher. Such a fall in the late 1920s would have all but wiped out the industry. Furthermore, the collapse in the Great Depression occurred over about three years, with the subsequent recovery taking slightly longer. In contrast, the recent fall in steel production occurred over six months (at most) in late 2008 and early 2009, with recovery to prior output rates occurring within about a year – steel production posted a new annual record in 2010. As can be seen in Figure 1, China provided the key support, while the rest of the world bounced back despite lingering financial and economic problems in Europe and the US.
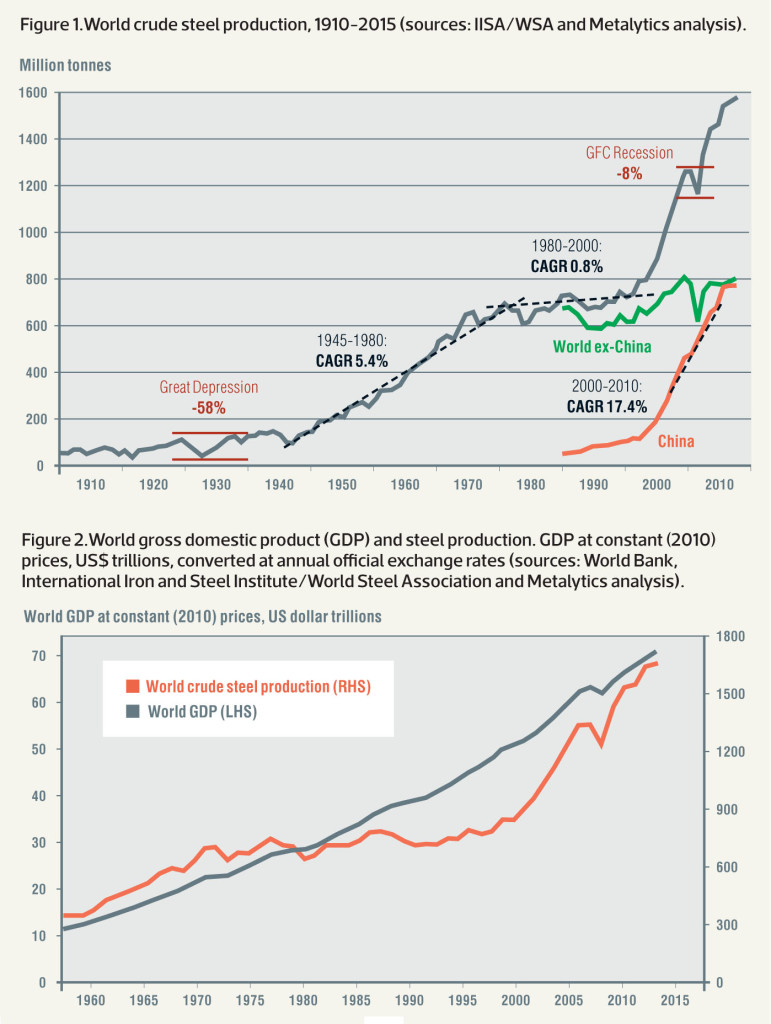
Figure 2.World gross domestic product (GDP) and steel production. GDP at constant (2010) prices, US$ trillions, converted at annual official exchange rates (sources: World Bank, International Iron and Steel Institute/World Steel Association and Metalytics analysis).
Long-term forecasts of economic development are fundamentally dependent on demographic projections and, despite uncertainties over specific growth rates and trajectories for individual nations and regions, most current, well-structured analyses conclude that the global economy will expand by around three per cent per year on average over the next several decades. Such growth produces a doubling in the size of an economy every 24 years and compares with an average growth rate of 3.5 per cent per year achieved over the last half century (Figure 2). Even a two per cent annual rate results in an economy doubling in size after 35 years.
Growth rates in world steel production and gross domestic product (GDP) tracked each other closely from the 1960s through until the early 1980s. Steel growth then lost its impetus, largely as a result of the fall of the Soviet Union and its power bloc. The remarkable growth rates in Chinese urbanisation and concurrent industrialisation have, of course, been the principal drivers of the surges in mineral and metal demand over the last 15 years. As Figure 2 shows, the recovery in steel’s fortunes has been sufficient to restore the long-term symbiotic relationship with global GDP.
Urbanisation is occurring across the world in emerging economies, and in 2010, urban population exceeded rural population globally for the first time. United Nations projections indicate that two-thirds of the world’s population will be urbanised by 2050. Urbanisation requires steel for housing and commercial construction, transport infrastructure, energy and utilities supply, sewerage systems, social infrastructure assets, appliances, private cars, local support industry and service provision and consumer products. Urbanisation supports industrialisation and vice versa.
Another point of overall consensus is that world economic growth will be heavily concentrated in developing countries and emerging markets, resulting in India, Brazil and Indonesia joining China among the world’s ten largest economies. South Korea, Mexico and Turkey are likely to rank in the top 15. Moreover, there will be up to three billion more middle-class consumers by 2030, when world population may reach about 8.3 billion.
The precise timing of such milestones is always uncertain because projections of relative GDP growth among different countries are unavoidably sensitive to assumptions on exchange rates and inflation. Nevertheless, the trends are essentially irreversible and trigger a range of almost inevitable consequences. Among many others, these include dramatic expansions in global urban infrastructure and the demand for various forms of transportation – especially privately owned motor vehicles. At the same time, distribution patterns of consumer spending and investment will change rapidly, along with global trade flows.
The steel industry’s role in global economic expansion can be summed up in one simple statistic – the construction, machinery and automotive sectors account for 80 per cent of world steel demand.
World steel production of 1.67 Bt in 2014 generated a demand for 2.16 Bt of iron ore (on a saleable product basis). Even though steel is one of the most recycled materials on earth, scrap provides feed for only about 30 per cent of current world output, with the remainder coming directly or indirectly from newly mined iron ore. Over the coming decades, scrap’s share will grow as steel consumed during China’s boom years progressively joins the recycling stream and world steel production growth rates moderate. While these factors should increase the scrap ratio to around 35 per cent in the period 2020-2025, iron ore will continue to be the major source of iron units in world steelmaking.
Long-term pricing trends and the commodity cycle
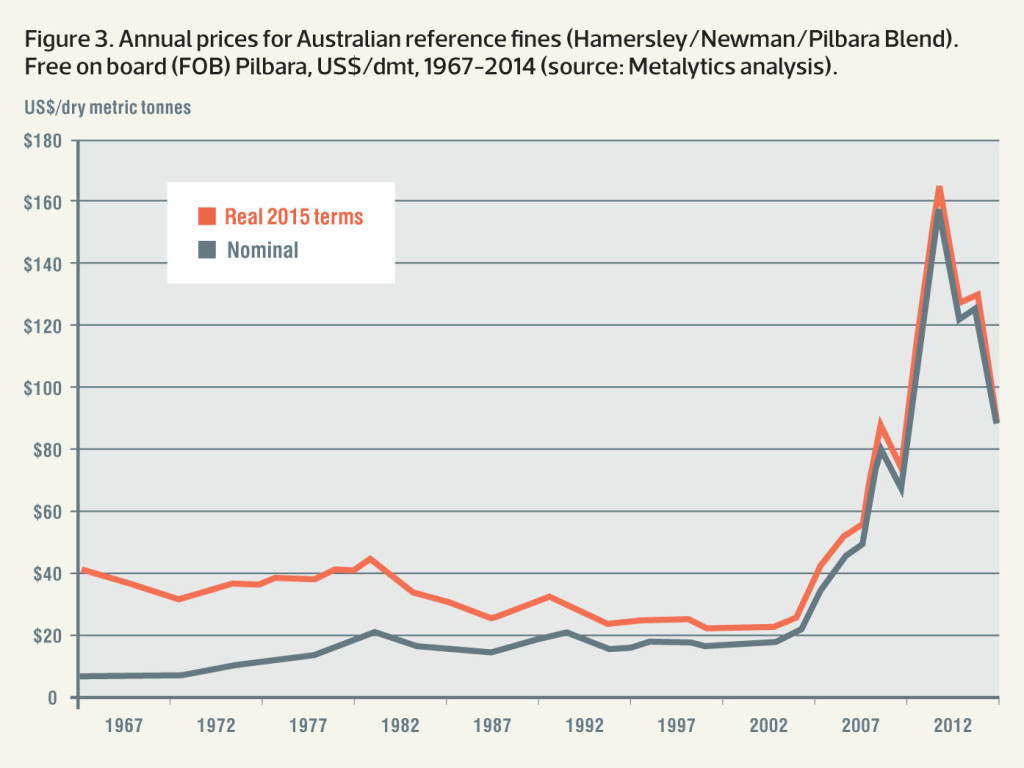
Real prices of many common mineral resources fell through most of the 20th century, along with those of the metals and other materials produced from them, providing significant support for world economic growth in the process. The main drivers of declining real metals production costs and prices included the discovery of large, easily exploitable mineral deposits; the development of new mining, extraction and transport technologies; and the creation of global raw materials markets. However, the early years of the 21st century saw a reversal of this 100-year trend. As demand for mineral commodities soared, both production costs and prices rose significantly.
For iron ore, this reversal in price trend is apparent in Figure 3. In real terms, the free on board price of Australian reference (62 per cent Fe) fines essentially traced a 20-year decline from the early 1980s until the turn of the millennium – the dawn of the China boom. Long periods of price malaise led to limited investment in capacity expansion and left the industry unprepared for China’s spectacular rise to become the world’s largest iron ore market, accounting for almost two-thirds of global seaborne trade. The resulting unprecedented price surge changed the nature of the market.
Among other factors, increased volatility in iron ore pricing has been a consequence of the move away from the benchmark system in 2010. All major producers now sell substantial tonnages directly into the spot market, and long- term contract prices are almost exclusively spot-index related, some with very short reference periods.
World seaborne trade has more than trebled in the last 15 years, and Australia’s exports have increased fivefold. Strong demand growth led to supply shortages and high prices, encouraging development of new projects. In particular, the ‘Big Four’ global exporters (Vale, Rio Tinto, BHP Billiton and Fortescue) embarked on significant capacity expansions to protect or gain market share and extend product ranges.
Major greenfield developments in bulk mineral commodities require considerable capital investment over long lead times. This is one reason why, superimposed upon long-term trends, mineral commodity price cycles are unavoidable.
Thus, in the present cycle, just as landed (cost-and-freight) prices in China for reference-grade (62 per cent Fe) fines could never have been realistically expected to hold the peaks of around US$180 dry tonne that producers enjoyed in 2011, protracted periods in sub-$55/t territory are equally untenable because at those levels too much of the world’s traded iron ore is not sustainably economic. Furthermore, the longer that prices remained high and encouraged new production, the steeper the inevitable tumble was destined to be. Contention among industry analysts has revolved around the timing and extent of a significant price decline rather than its likelihood. In addition, construction and ramp-up of new capacity has coincided with significant falls in petroleum prices and ocean freight rates as well as the long-expected easing of demand growth.
At this stage in the commodity cycle, high-cost producers are forced out of the market and are displaced by new lower- cost supply. In the current cycle, this response has been delayed by falling input costs, uncertainty about the timing of some major new projects and sympathetic exchange rate movements. Nevertheless, a number of small suppliers into the seaborne market have cut or suspended production.
In addition, around 60 Mt/a of Chinese concentrate production has been cut since the start of 2014, and declining mined grades will see further falls in the medium term. By 2020, Metalytics expects that Chinese domestic output will have more than halved from its 2013 peak of around 365 Mt (finished product basis), having been progressively replaced by lower-cost imports. Declining mined grades and increased regulatory pressures are key drivers in the continuing quest by Chinese government authorities and steel producers to secure long-term iron ore supply by investing in the development of new projects, notably in Australia, South America and Africa.
Subdued but positive prospects
While China’s steel production growth will now be much slower than in the last decade, it will continue to rise over the next few years from 823 Mt in 2014 to a plateau of around 900 Mt/a in the early 2020s. Beyond that, it should show gradual decline through 2030 and beyond. Although they will drive future long-term demand, India and other emerging economies will not generate the same level of growth as the China boom.
On this forecast, China’s steel production growth will slow from the compound annual rate of 13.4 per cent that has been maintained over the last 15 years to only 1.4 per cent per year over the period to 2020. Nevertheless, the magnitude of current steel production means that even under this much subdued scenario, world iron ore consumption, which has risen by around 350 Mt/a since 2010, will increase by a similar tonnage over the next five years. These forecasts include allowances for increased scrap availability and usage in developing countries as well as some significant long-term efficiency increases in steel production technologies and major end-use industries.
Such projections underpin the long-term requirement for additional global iron ore supply. While operating cost expectations are lower than they have been previously, market prices will need to be high enough to provide a reasonable investment incentive, particularly given the legacy of the post-boom slowdown and the consequent project failures. Tightening regulatory requirements will also be a constraint on project development. Environmental standards for steel mills will drive a requirement for high-grade raw materials, which generally have higher capex requirements, although Vale’s S11D will be a major new source of low-cost production.
Overall then, Metalytics forecasts that world annual iron ore consumption, which passed 2 Bt in 2013, will continue to rise, reaching 2.6 Bt in 2025. International seaborne trade, estimated at 1.35 Bt in 2014, should reach 1.8 Bt over the same period.
Australia overtook Brazil as the world’s largest exporter of iron ore in 1996, and Australian exports exceeded 750 Mt in 2014, which was more than double those of Brazil and accounted for 56 per cent of global seaborne trade.
However, in the medium term, new additions to capacity will outstrip closures and cutbacks, keeping pressure on prices. We currently see the market tightening around 2017, but subsequent slow market growth will again allow demand to be overtaken by supply availability.
A challenge for industry forecasters
The recent sustained falls in iron prices have not resulted from a decline in steel production or world iron ore requirements. Rather, current price levels reflect an overshoot in supply-side capacity and will recover when new demand catches up with supply and high-cost production exits to rebalance the market.
However, current projections for the world iron ore industry need to reflect trending changes in some fundamental market and production cost drivers. These include:
- lower global oil prices
- slower but inexorable world economic growth, with escalating consumer demand for steel
- China’s economic policy directed towards steadier, stable growth, with some targeted infrastructure spending and other supportive measures but without major stimulus
- overall lowering of the cost curve in response to industry-wide reduction of production costs in the wake of boom- driven inflation in materials, equipment, energy and labour
- lower US$ exchange rates for key producers
- lower sustaining capital expenditure levels and capital intensity for new projects, assisted by surplus equipment and engineering capacity following easing of the construction boom
- the need to embrace growing environmental concerns in both the industrialised world and developing countries at all stages of the steel industry value chain.
This is a somewhat different framework from that in which the Australian iron ore industry has operated over the last decade. However, dire predictions of an impending global industry contraction with long-term prices collapsing to so-called ‘reversion levels’ lack credible support. World iron ore demand is not about to stall. Rather, global seaborne trade will continue to expand and China will remain a major destination. Australia will hold its place as the world’s largest exporter with a seaborne market share of greater than 50 per cent. In order to support sustainable industry investment, long-term real prices will be significantly higher than current levels.