Powering the future of mining through in-house modelling
The mining industry is undergoing a major transformation. As global demand grows for low-carbon products, the need for critical minerals is increasing — and so is the pressure to mine them sustainably. Companies must adapt quickly to shifting market demands, stricter emissions targets, and evolving operational challenges. What will electrifying a haul truck fleet mean for production? How can remote operations reduce diesel consumption? Is it viable to rapidly deploy smaller mine sites to access dispersed ore bodies? Answering these questions requires not only innovation, but also the ability to drive and control that innovation internally. MATLAB® and Simulink® have been used worldwide to take ideas to production rapidly, making it the perfect platform for mining companies looking to adapt in a fast-changing industry.
Central to any decision-making are models. This could be a back-of-the-envelope calculation, a large Excel sheet, or complicated third-party programs, but fundamentally, any decision needs to be underpinned by a traceable description of your systems. To avoid waste, models should be reused where possible because they contain fundamental knowledge of the business they are based on. For this reason, businesses should use in-house modelling as core business activities, enabling rapid and reliable innovation based on proven techniques from other groundbreaking industries.
Flow-sheet modelling
Using a flow-sheet modelling tool allows users to graphically describe the flow of material from pit to port, keeping all stakeholders engaged through a common language.
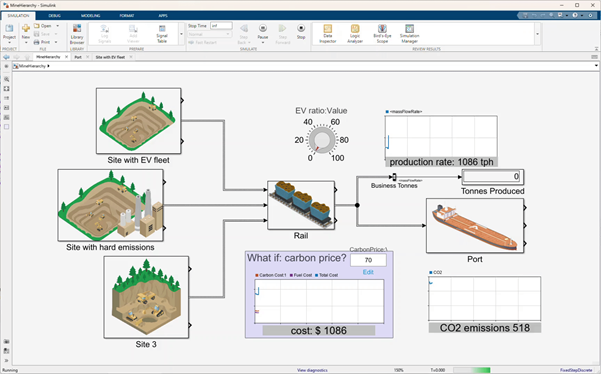
Figure 1- Business level view of CO2 emissions and productivity
To achieve fully flexible innovation, the models underpinning decisions and design changes need to be transparent and easy to explain to stakeholders. This implies they do not necessarily need to be linked into fixed dashboards, but rather provide a flexible environment to answer business questions. Depending on the questions, different timescales and levels of detail will be required. This can all be done in the same environment using MATLAB and Simulink with Process Industry Tooling.
In a model, like the shown in the included figures, all components contain data that can address specific questions of interest at that level. For example, in the top-level view in Figure 1, the model can present the total CO2 emissions, total productivity in tons-per-hour, as well as overall cost. Users can then add a possible scenario, such as a price on carbon emissions and directly assess the top-level impact.
In the figures shown, each of the blocks (like Site with EV fleet in Figure 1) represent a separate part of the business, with each block reporting key top level data while also providing more detail that is relevant for that section of the business. For example, within the picture of the train cars ("Rail" in Figure 1), the entire rail network can be captured, only reporting throughput and emissions at this level.
Electrification of a truck fleet
Diving a bit deeper into one of these blocks representing a mine site (see Figure 2), a model of the fleet of trucks for transportation of ore from pit to stockpile is captured. These trucks consume diesel and require maintenance, and as they are replaced with electric trucks, their requirements change. The trucks will run faster and need less maintenance but need more time to recharge. Typically, this transition results in an increase in productivity but it comes at an investment cost, so the timing of the transition is highly relevant to the bottom line of the business.
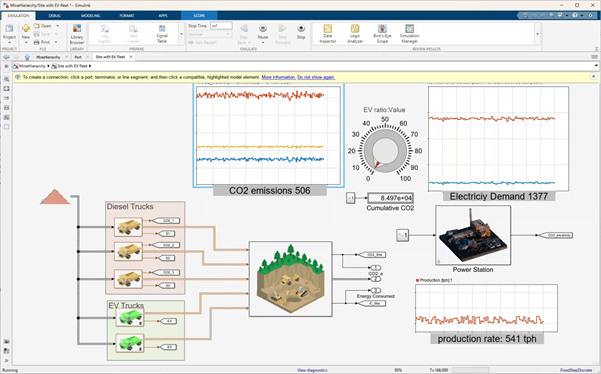
Figure 2 - Haul truck electrification impact on mine site
We can analyse the nuances of this business impact locally on a specific site, and see the results automatically feed into the top-level view of the business. The same models used in day-to-day operations can also be used to analyse hypothetical scenarios. The results can then be used to establish an optimal transition from diesel to electricity for the haul truck in the mine pit.
Process Optimisation
Optimising the behaviour of any aspect of the business becomes easier when using models. For example, an engineer could optimise mine schedules to extend profitability for the life of a mine, or it can be optimal blending to minimise disturbances in ore processing or adjusting set-points in a plant to handle variations in feed material.
As ore is processed into final products, several processes take place that are impacted by disturbances and variations in the feed material and environmental conditions. Models of these processes are used to control and operate processing plants, so it is natural to include these models in the same environment as shown in Figure 2. This allows users to report on details that previously would require separate analysis. For example, what is the power consumption per ton of processed ore? How much CO2 is emitted when processing the ore? At this level, the exact emissions related to energy may not be visible, but by tracking it in the model, it can be reported upwards and then accounted for at a business level against energy production and consumption.
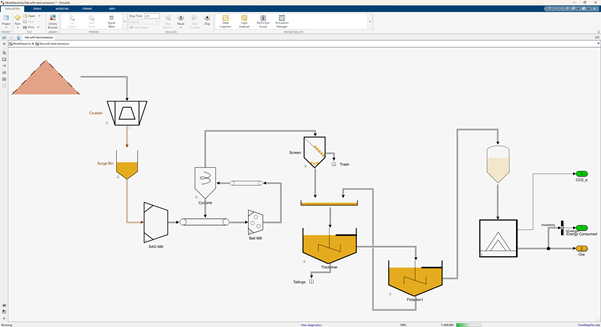
Figure 3 - Plant operation in same modelling environment
One platform to design your business
Communicating information clearly is a key requirement for business decisions. An innovative business cannot afford to outsource such models to third parties but instead must maintain control by utilising the know-how and experience of the team. Using MathWorks Process Industry Tools provides the ability to capture and leverage business knowledge in manageable, bit-sized components that all come together to affect the bottom line of the business.
Disruption in the form of innovation is coming to the mining industry. The best way to prepare is to be ready to lead this innovation.
Learn more about how to take advantage of the coming changes at mathworks.com/solutions/mining.
This article was originally published on Australia's Mining Monthly and written by Mathworks who are exhibiting at APCOM 2025, Perth, Australia.