
Case study: Industry 4.0 – Advanced mill optimisation
The pressure is on for mine operators to increase efficiency and improve overall recovery despite falling ore qualities.
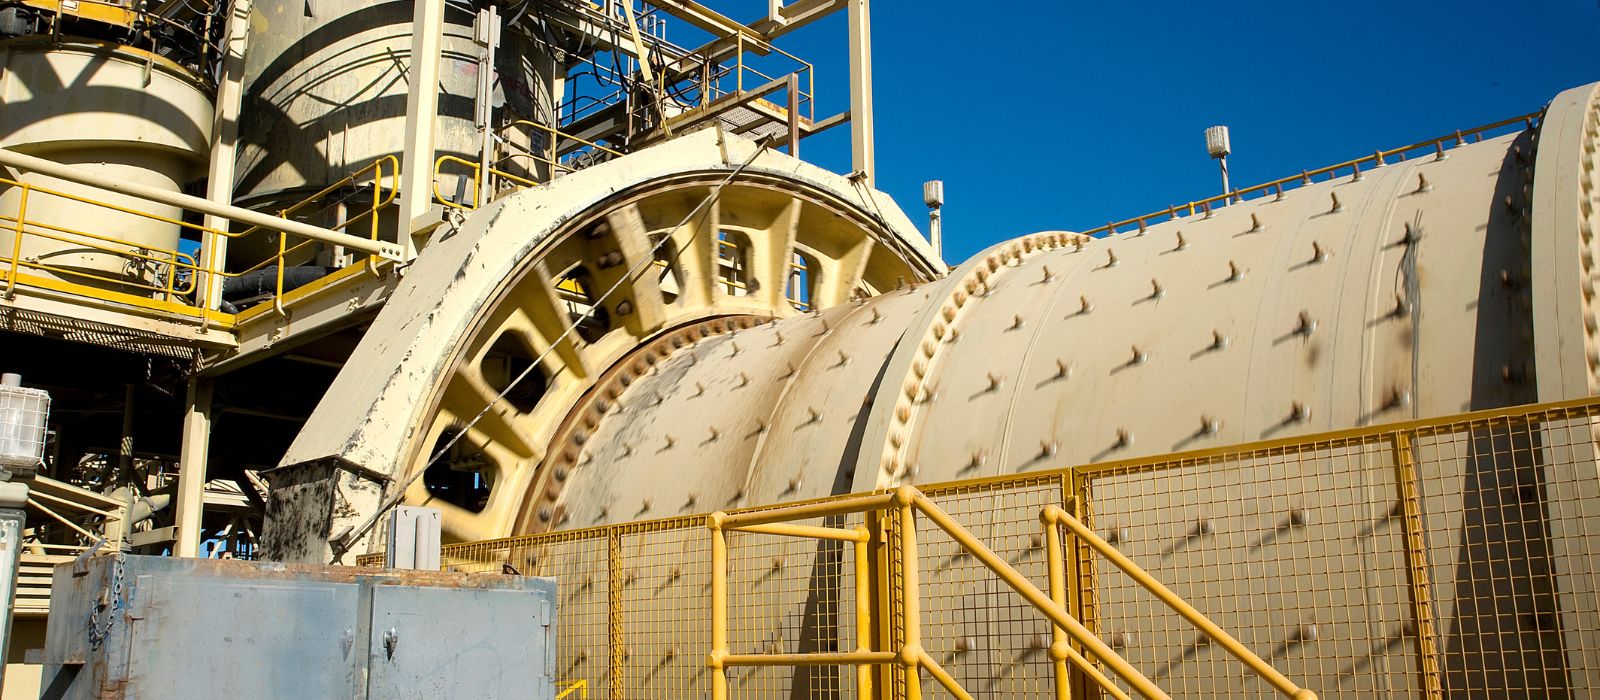
With this in mind, grinding is well known to be the main engine of any concentrator. Grinding is the essential first step in reducing the material for downstream processes, such as flotation and separation. It is also one of the top areas for power consumption; hence maintaining an efficient and reliable grinding circuit is crucial to any concentrator operation.
In this article, we discuss the professional application of FLSmidth LoadIQ smart sensor, a third-generation technology built on extensive mining experience. This can optimise mill load using a system of combined smart sensors and advanced software, typically achieving throughput increases of three to six per cent in concentrators around the world, with some operators even achieving up to 10 per cent increase in throughput.
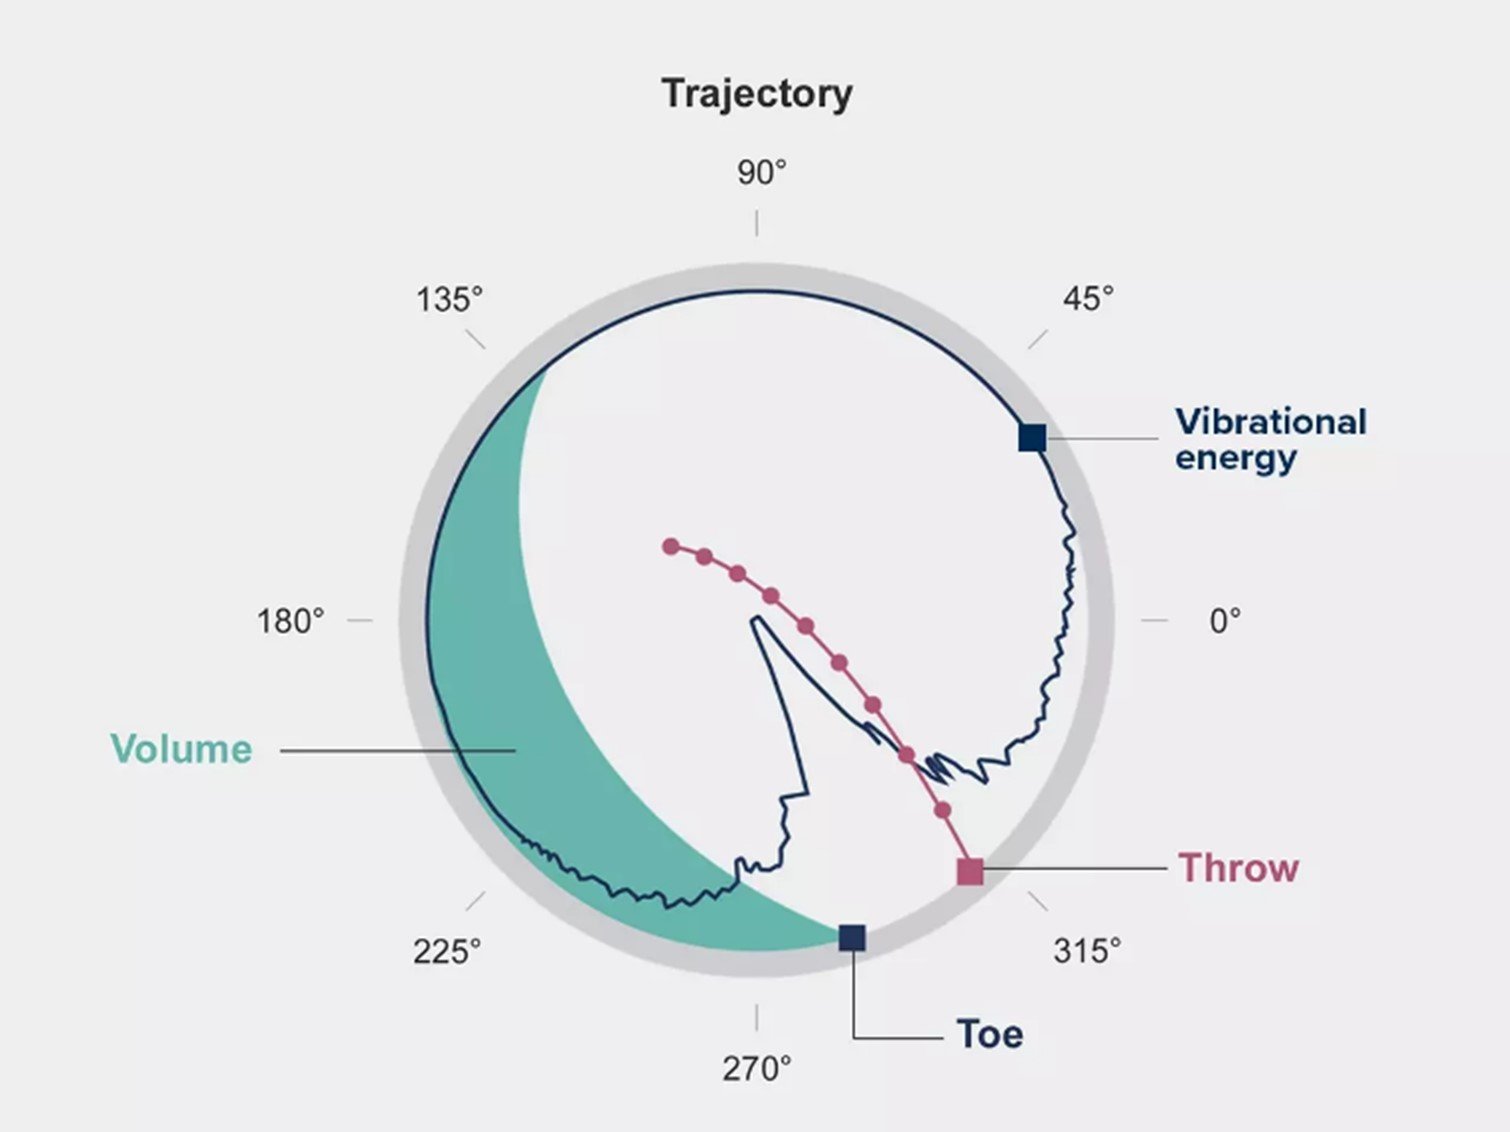
How does it work? Smart sensors infer the location of the mill load and identify the ore trajectory in real-time. The readings gathered are then combined with other process readings, such as feed particle size distribution (PSD), bearing pressure, power, etc. to determine the optimum mill load. Integrated within the system is a combined advanced process control (APC) system which can automatically adjust key parameters to provide the optimal throughput & efficiency.
Achieving optimal mill load
In most semi-autogenous grinding mill control strategies, bearing pressure or load is used as a target to adjust mill throughput. However, setting this target can be difficult since bearing pressure does not account for changes in ore size, oil temperature, mill direction, liner wear, or mill density. The LoadIQ sensors can bridge these gaps in real time. The technology then uses data analysis, along with this real time smart sensor data, to identify changes in the mill feed and load and identify the correct load target to achieve maximum grinding efficiency.
Achieving maximum efficiency
To achieve maximum grinding efficiency, the mill load and RPM high limit must be adjusted in real time as the conditions of the feed and liners change. As the liners wear, the ability to lift the material so that it reaches the toe of the charge may not be possible. In cases where this is true, the RPM will be increased, or the mill load target will automatically be decreased until the toe is impacted, thus restoring maximum efficiency. Conversely, with a new set of liners, the trajectory at high RPM will likely cause excessive liner strikes. In these cases, LoadIQ automatically reduces the maximum allowable RPM such that the cascading ore is impacting the charge toe.
The system and its interface
This is a fully integrated technology that uses a simple interface. The diagram below outlines the main components of the system and how it can be connected.
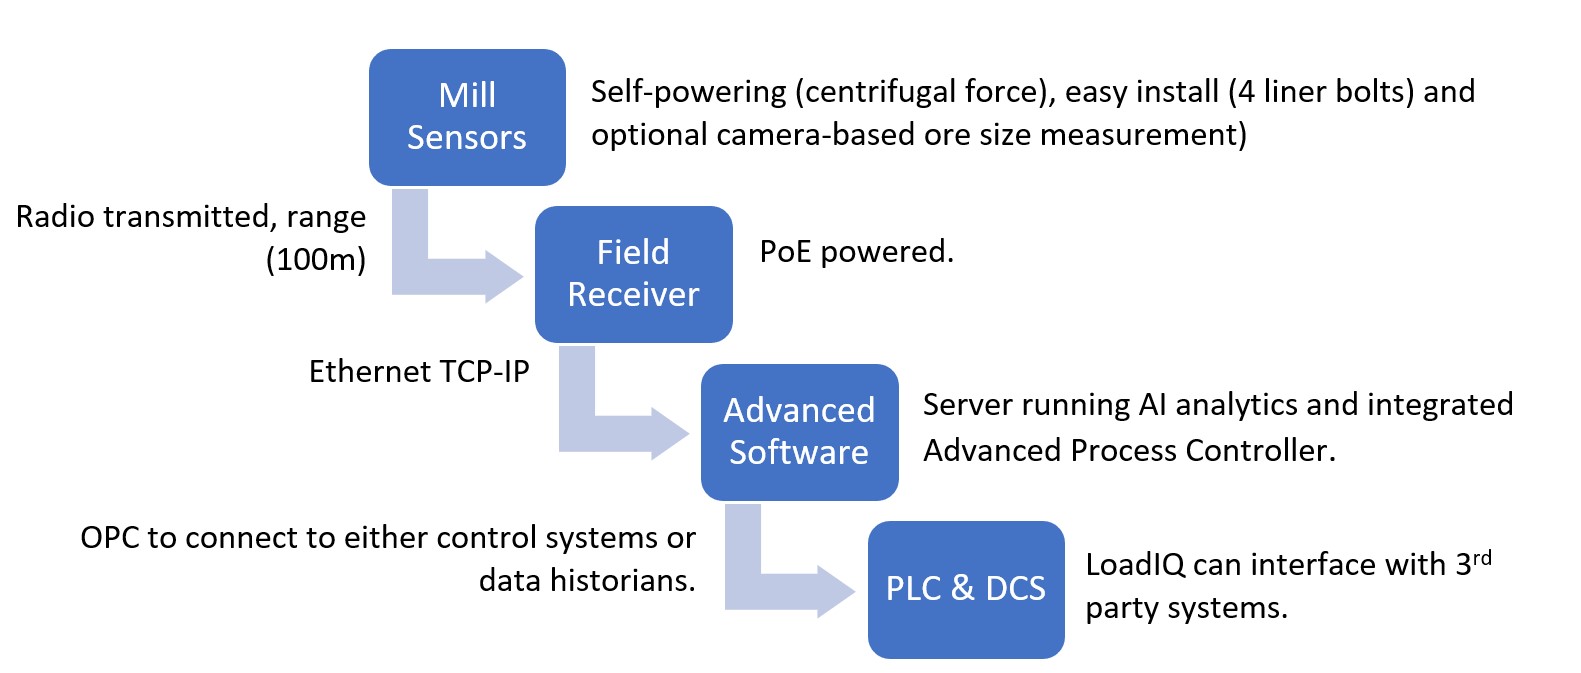
The software has been designed to incorporate a web-browser interface, enabling easy local and remote access as well as simplifying software maintenance. The server calculation engine has also been upgraded to the latest AI technology and has an improved diagnostic and maintenance porthole. The server can be hosted in-situ or virtualised.
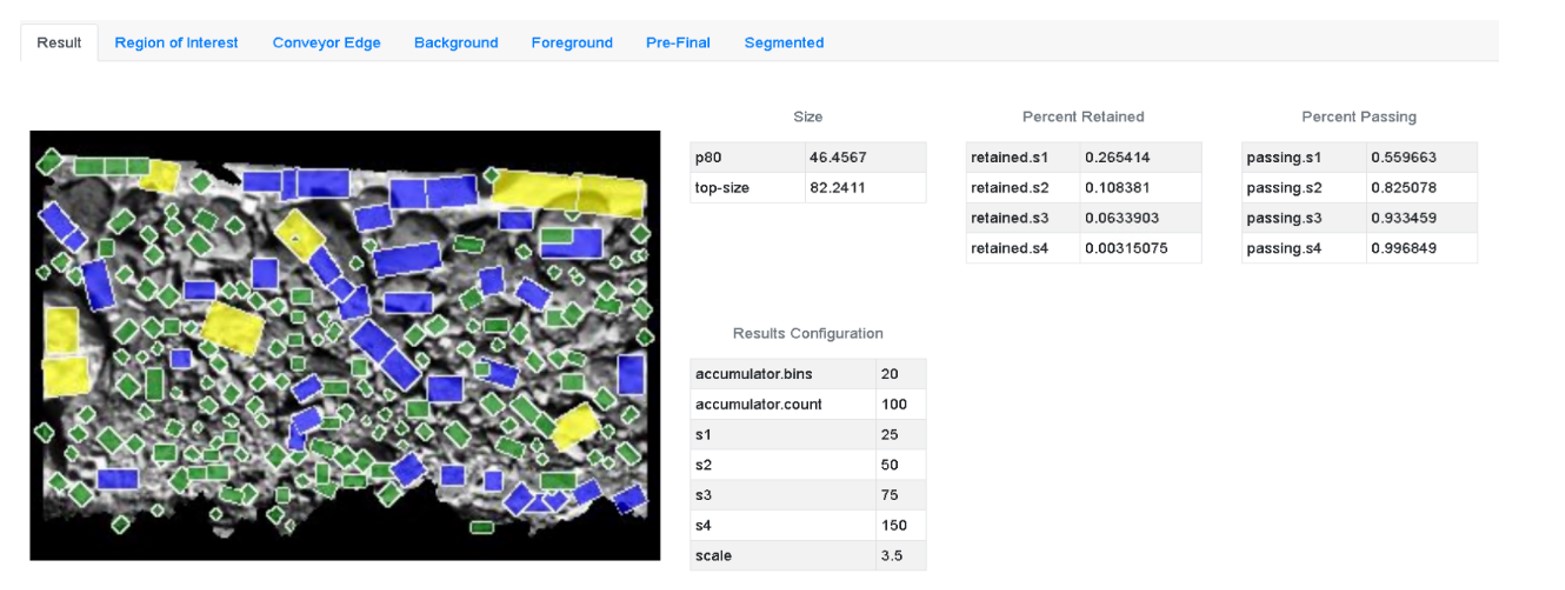
Below are a few figures showing the system interface and features. Note that default FLSmidth software is shown, though, if required, the operator can generate their own views within their control system for operator ease and full integration. Certain functionalities and features are only hosted in the FLSmidth software for servicing and maintenance purposes. Having said that, most parameters are able to be exported to the operator’s control system via standard OPC communication protocols.
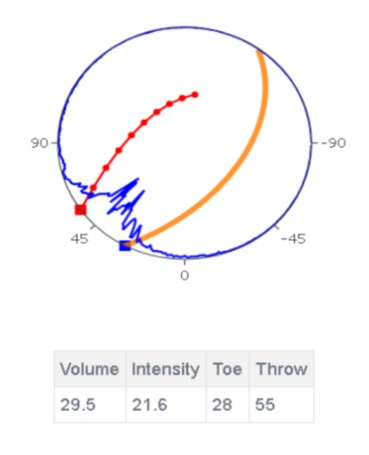
Main interface: blue line is the measured intensity, red line is the estimated throw and trajectory, while the orange line is the estimated load with corresponding toe. Volume, intensity, toe, and throw can be exported in real-time via OPC.
All shown parameters can be exported via OPC.
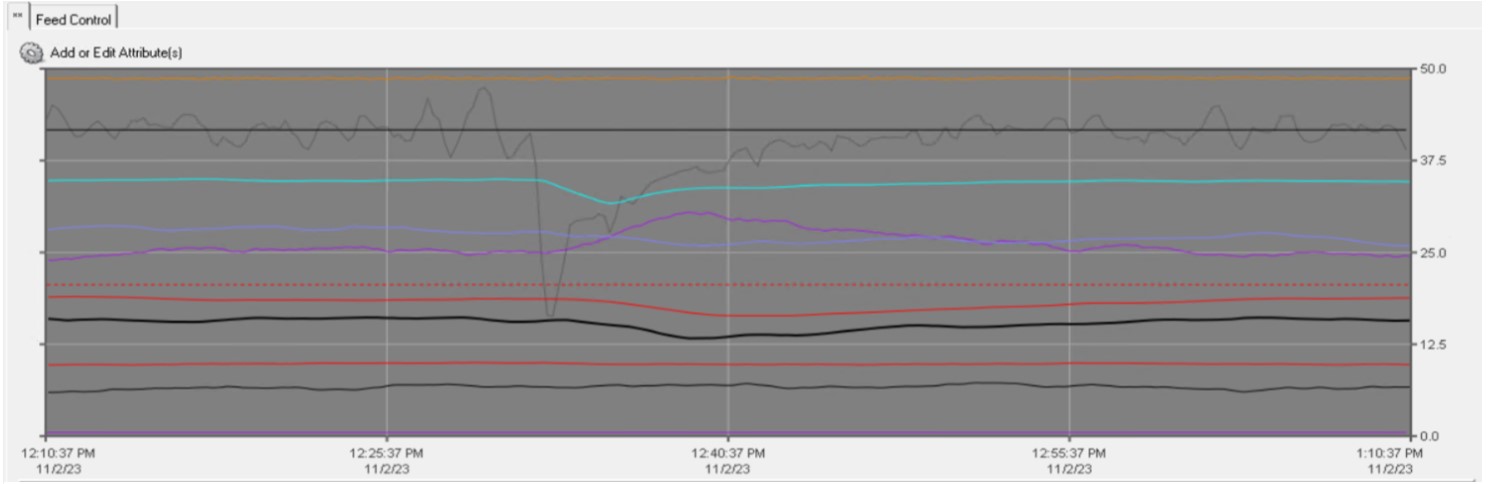
Black = Toe, Purple = Intensity, and Grey = through-put.
A gold mine case study
A recent APAC gold miner knew that their rubber-line composite SAG mill circuit was under performing, and that things needed to be changed. Their key business driver was to optimise the process in such a way that it could adjust/react to favourable changes in market conditions. Being a fixed speed mill and limited to power draw, water and grinding media, the question was if and how digital technology could be used to improve the overall mill performance.
In response, LoadIQ was installed and able to reduce the response time and continuously monitor and adjust the operation in real-time to ensure the mill kept the particle breakage efficiency at its ‘sweet spot’. The new system accurately measured the location of vibration intensity and impacts of the load, allowing for a better understanding and optimisation of the mill in real time. The wireless system was installed in less than a day, and being self-powered, no external power source was needed. The system was configured with a particle size distribution camera on the feed belt and our patented advanced process control system.
The results below showed immediate benefits to throughput while retaining the required PSD. Maintaining the mill control within tight parameters showed not only increased stability and throughput but also reduced issues downstream. The system showed an increased throughput of 17 per cent and was able to keep the mill stable in this high efficiency condition.
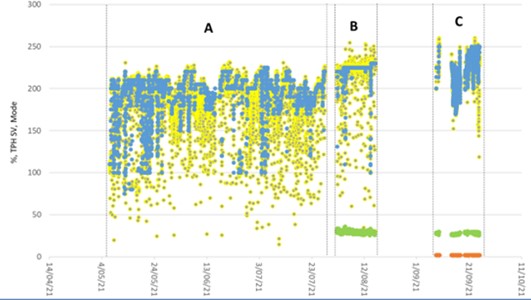
A: Base-case, B&C: LoadIQ (Blue is throughput and Yellow is mill power).
Note the absolute power did increase in section C; however, the efficiency (ie tonnes/MW) did at worse remain constant, and at best was lowered.