
Copper concentrate marketing 101
An overview of copper markets and an insight into the forces shaping global demand for one of the world’s most important commodities
What a great time to be writing about copper. Putting pen to paper, I can see that the copper price is now (12 Apr 2021) about US$4.06/lb (US$8954/t). Only 12 months ago, you would have been forgiven for thinking that $3.25/lb was overly optimistic.
Those considering new projects or expansions can feel vindicated about their faith in the red metal. Existing operations can take advantage of the price surge, provided they have not made prior decisions limiting their enjoyment of the higher prices. Sometimes, marketing decisions made at a project’s development stage can lead to significant opportunity losses at the operational stage. Therefore, it is critical that miners understand the structure of the market for copper concentrates in order to value and optimise returns.
If global copper supply is examined, once solvent extraction and electrowinning (SXEW) and secondary production are removed from the equation, the overwhelming balance is made up of copper concentrates. These concentrates are processed by copper smelters. Historically, Japan and Europe were centres of demand for concentrates, but the epicentre has now shifted to China. Other markets still play an important role, especially when the burden of freight is added to sales. In Asia and outside China, key smelters exist in Japan, Korea, India, Indonesia and the Philippines. In Australia, the two remaining smelters are BHP’s Olympic Dam and Glencore’s Mt Isa operations.
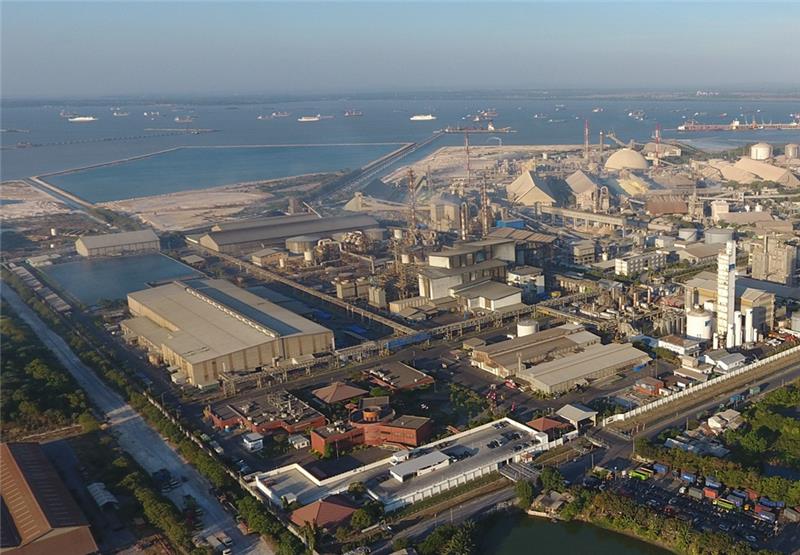
Copper smelters can be classified as integrated or custom. Integrated smelters, as the name suggests, process concentrates from their own mine(s) to anodes and (usually) cathodes. Custom smelters process concentrates from non-related entities (also called custom mines). However, the lines of distinction have become blurred. Smelters which were once fully integrated will now purchase third-party concentrates. Also, many smelting entities have taken equity positions in mines, thus securing long-term feed from ‘captured’ sources.
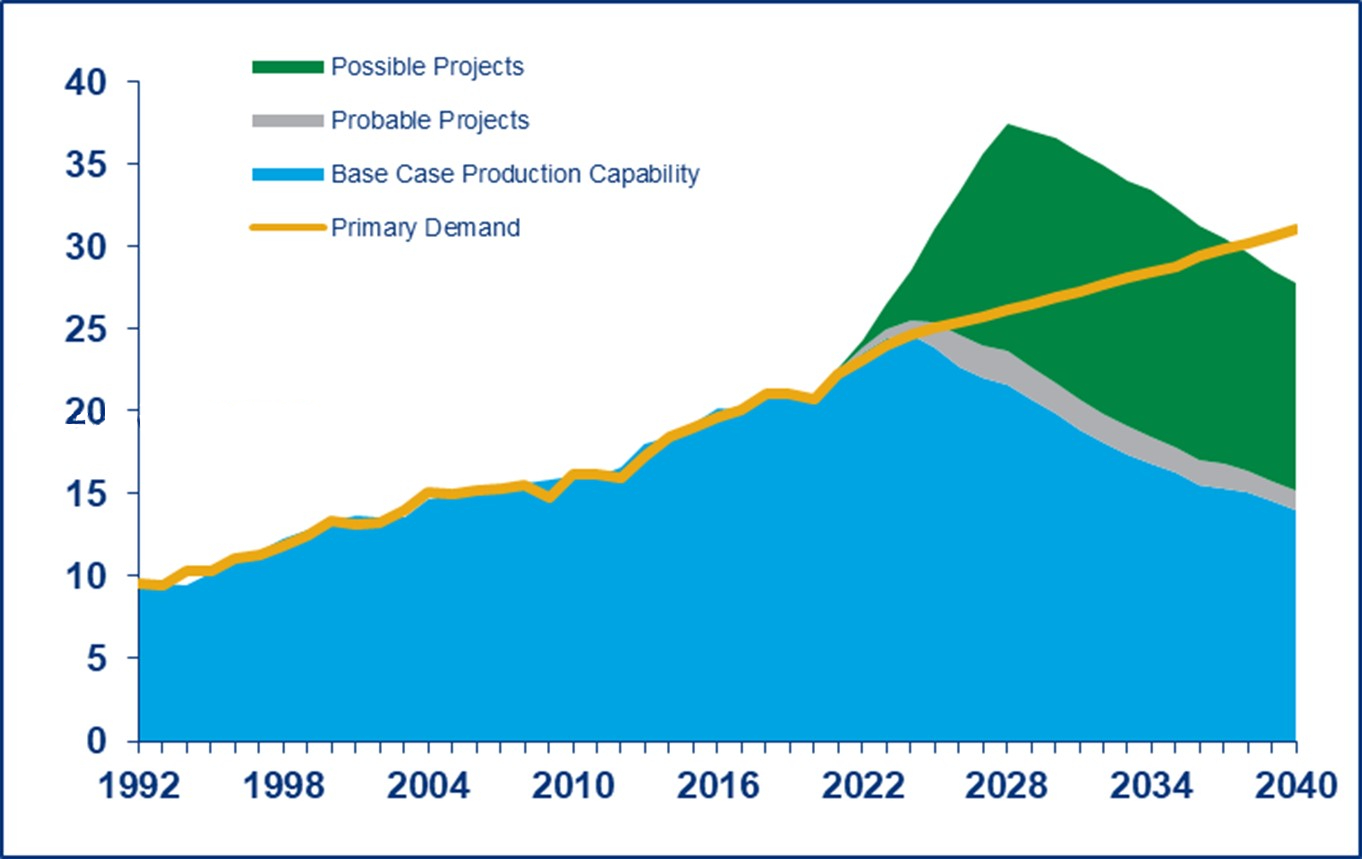
Global copper-in-concentrate production in 2020 is estimated by Wood Mackenzie to have been approximately 17 Mt. The custom share of the market is estimated to have been about 10 Mt in 2020 (on a copper contained basis).
Figure 2 shows both historical and forecast production (concentrate and SXEW) against primary demand.
Miners can also sell concentrates to traders. Traders will then (generally) on-sell the concentrates to smelters. A development since the early 2000s has been the establishment of blending facilities. Whereas a smelter may purchase a number of qualities and blend on-site (and nowadays off-site), traders will blend concentrates at their own facilities and then on-sell the blended material to smelters.
Traders play an important role in the market as they add liquidity. They can also assume risk. Through the blending of concentrates, they can take complex material (with high levels of deleterious elements) and blend to a quality acceptable to smelters. Traders, from time to time, also finance mines through a variety of mechanisms ranging from debt to advance and pre-payments.
Traders may now account for approximately 45 per cent of the custom/traded market.
In establishing an off-take contract, a mine must not only consider Treatment and Refining Charges (TCs/RCs) and metal payability rates, but also a myriad of other terms which will have an impact on realisation costs and the Net Smelter Return (NSR).
Buyers (both smelters and traders) regard all terms as sources of revenue and will trade off one factor against another. It is therefore not possible to isolate entirely each commercial term. For example, improved copper payability may lead to reduced revenue in another area.
Metal recognition is expressed as a percentage of the agreed analytical value of payable metals. Smelters probably capture a bit more than the percentage they are prepared to pay. The difference can be termed as free metal. If prices rise, so does the value of the free metal to the smelter.
A TC/RC benchmark framework currently exists for copper concentrate. The benchmark is negotiated by major producers and major smelters on an annual (calendar year) basis. Since about 1990, the benchmark was set by one of Escondida, Freeport Indonesia, Highland Valley or Ok Tedi with (almost always) the Japanese smelters. During much of the last two decades, the benchmark has been dominated by Freeport and Antofagasta Minerals. The benchmark is now mostly set with one of the major Chinese smelters.
Over recent years, producers both large and small have taken steps to move away from the benchmark. The rationale has been varied but it does include the disparity amongst concentrate qualities. The benchmark applies to a full calendar year. So shorter-term pricing will capture intra-year volatility.
Spot TCs/RCs are negotiated on a short-term single or multi-shipment basis. Spot sales are generally made (by mines) to traders, or traders to smelters. Sales (typically to traders) can also be linked to the benchmark, without accepting the absolute level of the benchmark.
Wood Mackenzie shows changes in the benchmark, as well as spot TCs/RCs over the past decade in the chart below (Figure 3).
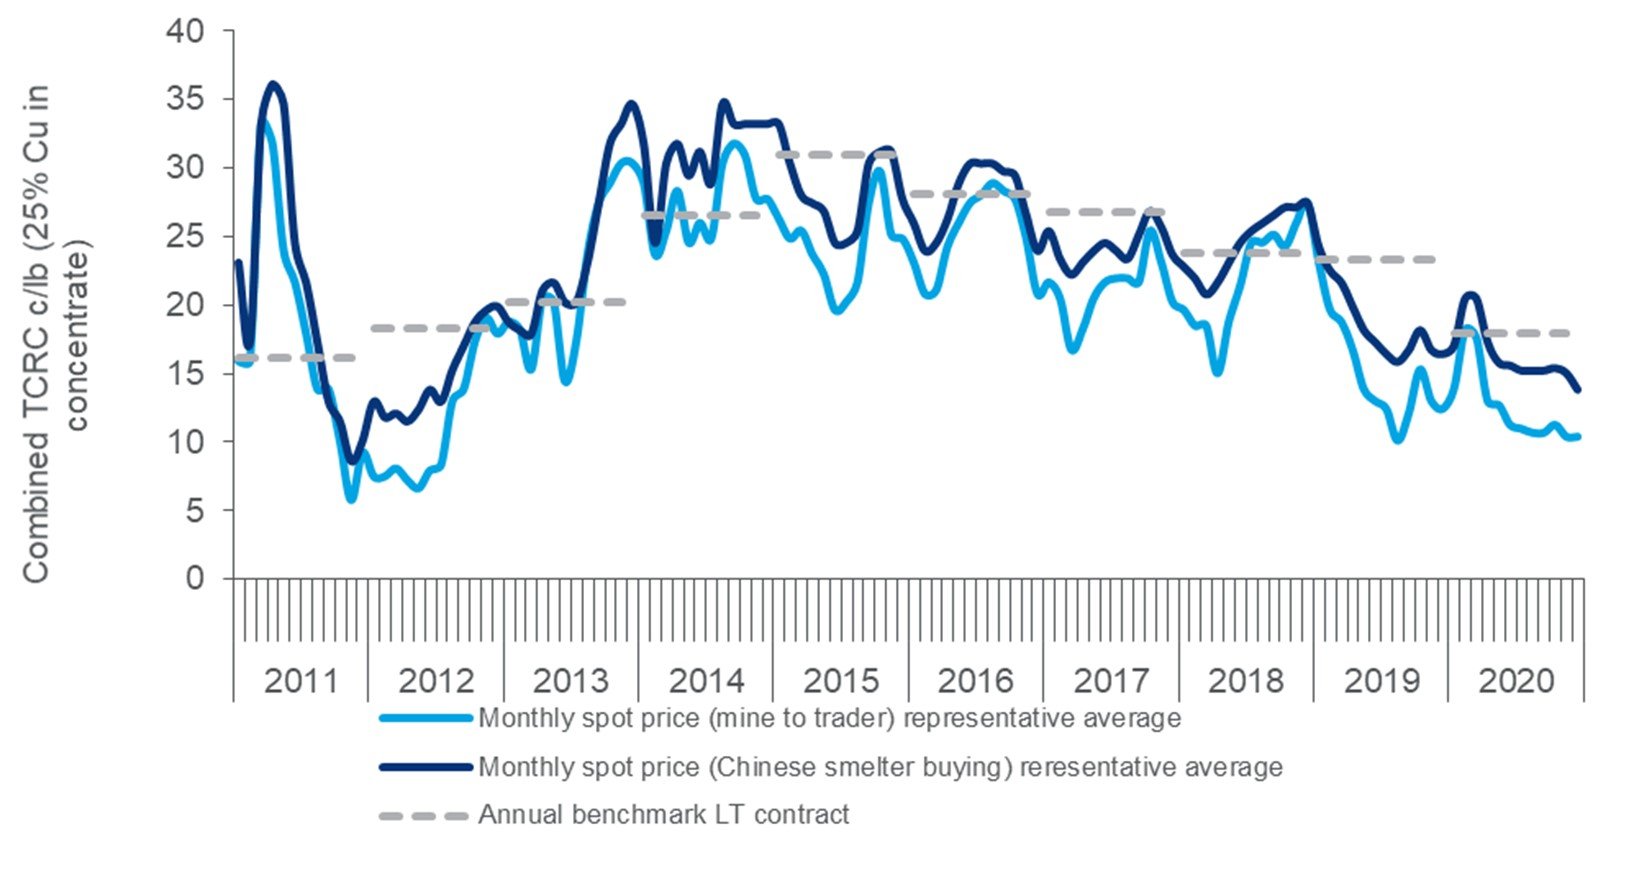
Broadly speaking, one can expect spot terms to be below the benchmark during times of concentrate deficit, and to exceed the benchmark during times of surplus.
The Price Participation (PP) mechanism, where the copper refining charge was linked to the prevailing copper price, was removed from most market contracts in approximately 2007 (de Sousa, 2012). The traditional PP arrangement allowed the copper refining charge to vary by an amount calculated by applying a percentage of the prevailing price, over or under a specified trigger price. Historically this percentage was 10 per cent of the price above or below USD0.90/lb. Consequently, at a price of USD3.00/lb, the delta of USD2.10/lb above the trigger price would generate an additional charge of USD0.21/lb to be added to the contractual refining charge.
Other commercial terms will include penalties for deleterious elements, price references (known as quotational periods), payment terms and shipping terms. Protocols to be applied to weight determination, sampling and assaying must also be established. None of these terms has a zero-commercial impact. However, many will say that it is a zero-sum game.
In formulating a marketing plan, miners should determine the saleability of their production to different smelters in different geographical markets. Not all smelters are the same and a smelter’s propensity to treat a specific material may vary over time. An abundance of fluorine-in-concentrate (deleterious) from a large producer will limit the acceptance of fluorine from other producers. The same may be said of other elements, especially arsenic. Regulations in different jurisdictions may also limit or prohibit the import of some concentrates. Also, regulations are not static over the long-term.
Precious metals (gold and silver) will attract different rates of payability in different markets. The return to miner will depend upon the ability of the smelter to recover the metal. Generally, it can be observed that the technical ability of smelters to recover metal has improved over time. Whether or not the benefits these advancements are passed onto the suppliers of concentrate is always a matter for negotiation.
Generally, all items are up for negotiation and all terms should be assessed to determine accurately the NSR.
References
de Sousa, A (2012). ‘Chapter 20, Commodity Marketing – Copper’, Cost Estimation Handbook, 2nd Edition, AusIMM, AusIMM 2012, pp484.
Acknowledgments
Thanks to Wood Mackenzie for their excellent charts and data and to my good friends at Mitsubishi Materials Corporation in Japan and Indonesia.
About the author
Albert de Sousa is a Director and Principal Consultant of AFX Commodities. After almost 30 years working for two large Australian mining houses, he now consultants to the broader base-metals and gold industries (albert@afxcom.com.au / www.linkedin.com/in/afxdesousa).