
Improving convergence monitoring using LiDAR data
Summary
Rio Tinto engaged LiDAR (Light Detection and Ranging) specialist MINELiDAR to demonstrate an improved method for convergence monitoring.
SLAM-based LiDAR data, captured by Emesent’s Hovermap mobile mapping system, was compared to traditional tape extensometer measurements. Designed for GPS-denied, harsh underground environments, Hovermap is able to rapidly scan and process accurate, high resolution point cloud data of drives and other excavations. The findings include:
- Extraction drives (approximately 200 m) were scanned in seven minutes using Hovermap in a vehicle-based configuration.
- Point clouds were generated in 20 minutes, with processing displacement taking approximately one hour per extraction drive (using manual processing). Recent Emesent software upgrades have further reduced these processing times.
- Mean variance between the Hovermap and extensometer- based convergence measurements was 3.97 mm, inferring LiDAR data offers sufficient accuracy for this use case.
- The Hovermap LiDAR-based solution significantly improved data continuity, safety and areal coverage.
The Hovermap can be used for additional purposes beyond displacement monitoring. They include:
- Mapping of drives, stopes, and vertical and underground infrastructure
- Calculating stope volume, backfill, over- and under-break
- Mapping geological structures
- Building information models
- Reconciling stockpile volumes
- Inspecting falls of ground.
Introduction
Convergence monitoring is standard practice at underground mine sites. Historically, displacement in drives is measured wall-to-wall, using tape extensometers. This method is time consuming and only measures at fixed, coarsely spaced locations 0.8 m to 1.5 m above the ground; thus creating spatial bias. The method is sensitive to damage and replacement of wall pins and can expose personnel to significant underground hazards.
More recently, mines have utilised stationary/semi-mobile (stop-start) laser scanners to monitor displacement. Such systems offer a high level of precision and greater spatial coverage but can be time consuming to deploy and often do not integrate well with on-site mine visualisation software.
Simultaneous Localization and Mapping (SLAM) scanning, using Light Detecting and Ranging (LiDAR) sensors, is evolving rapidly. The technology is already widely used by mines to measure stockpile volumes and visualise inaccessible voids, such as stopes and drawpoints.
Emesent’s mobile SLAM-based LiDAR mapping system, Hovermap, offers a variety of data capture methods to suit the environment (vehicle, drone, backpack and tether) and can scan a wide area rapidly. It can be operated remotely, with personnel remaining safe under supported ground, while providing a full understanding of displacement around the target, at an acceptable level of accuracy.
Here, we evaluate the reliability and repeatability of convergence measurements conducted in a drive at Argyle Diamond Mine in Western Australia. Convergence is typically associated with the Gap Fault that transects the deposit and the loads induced from block cave mining. Excavations located near the fault typically yield and converge, and routine convergence monitoring provides trigger points for rehabilitation. The specific objectives of the study were:
- Measuring drive displacement and convergence across broad areas of a development drive (backs and walls)
- Integrating the captured point cloud data into existing mine visualisation systems
- Ascertaining the level of precision achieved
- Minimising underground time for personnel in high risk environments and production delays associated with data acquisition.
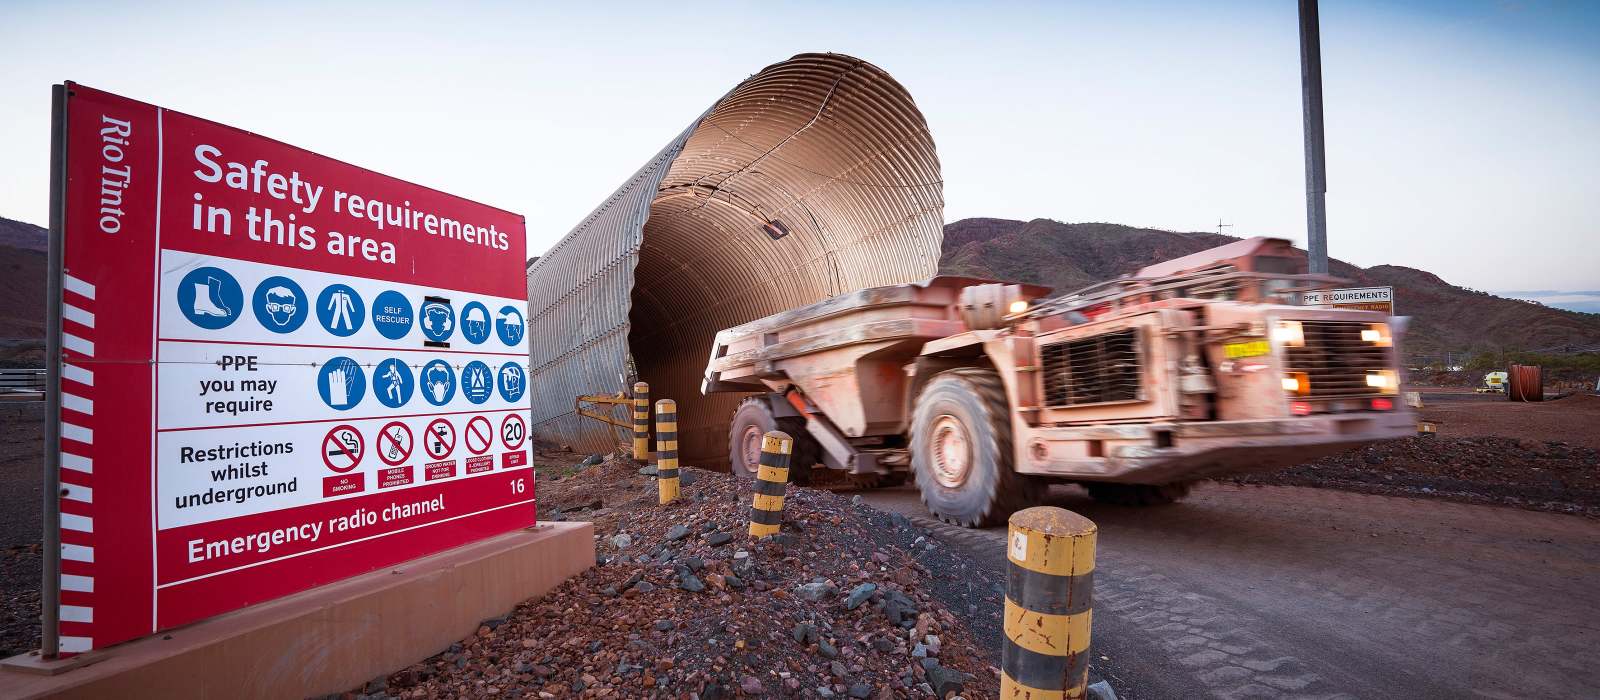
Argyle Diamond Mine
Rio Tinto’s Argyle Diamond Mine is situated in the northeastern part of Western Australia, approximately 2,200 km (1,370 miles) northeast of Perth. Recently closed, Argyle was one of the richest diamond deposits in the world and famous for its unique pink diamonds. The mine had an ore grade of approximately 3.0 ct per tonne of host rock and a peak production of 40 Mct p.a.
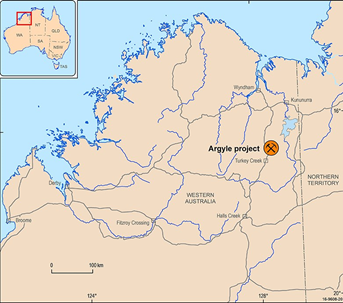
Location of Argyle Diamond Mine, Western Australia. (Source Geoscience Australia).
Methods
Convergence data was collected from drive ED07 and an underground workshop area at Argyle using both the Hovermap LiDAR scanning system and tape extensometers. This exercise took place during two site visits: the first in December 2019, and the second in January 2020. The month gap between captures facilitated the detection and measurement of notable convergence. Another three drives, ED05, 11 and 15, were also scanned using Hovermap, but do not form part of this evaluation.
Convergence measurement overview
It is important to note the differences between point cloud displacement results and the convergence data obtained from tape extensometers. The tape extensometer method gives a distance between two paired points in a tunnel; specifically, between one side of the drive and the other. Displacement measured via this method may be wrongly assumed to be equal on both walls and can only be validated imperfectly, through visual observation. Three points of five point convergence can realise these measurements more accurately, but this method is rarely used, due to the increased time it takes and the potential for obstructions, such as ventilation bags.
By contrast, displacement calculated from point clouds is the distance between a group of points in the direction of a calculated normal, and is independent of the rest of the tunnel. This methodology provides an understanding of which side of the tunnel is moving and by how much.
Distribution of stress in the surrounding rock means drive convergence is typically non-uniform and displacement of a tunnel is unlikely to occur directly in the axis of the tape extensometer. This difference means:
- The two methods should not be directly compared, and consideration should be given if comparisons are made
- Comparing point clouds can display displacement relative to the tunnel surface, not just in the direction of the tape extensometer.
With these differences in mind, three comparative approaches were used to compare tape (extensometer) and point cloud data. These were:
- Comparison of LiDAR and extensometer measurements for the complete drive
- Comparison of 2 m slices around extensometer measurements
- Comparison of an area where no major movement was expected.
Tape extensometer data capture
Tape extensometer data was collected on both site visits, with measurement recorded to 0.01 mm.
Hovermap data capture
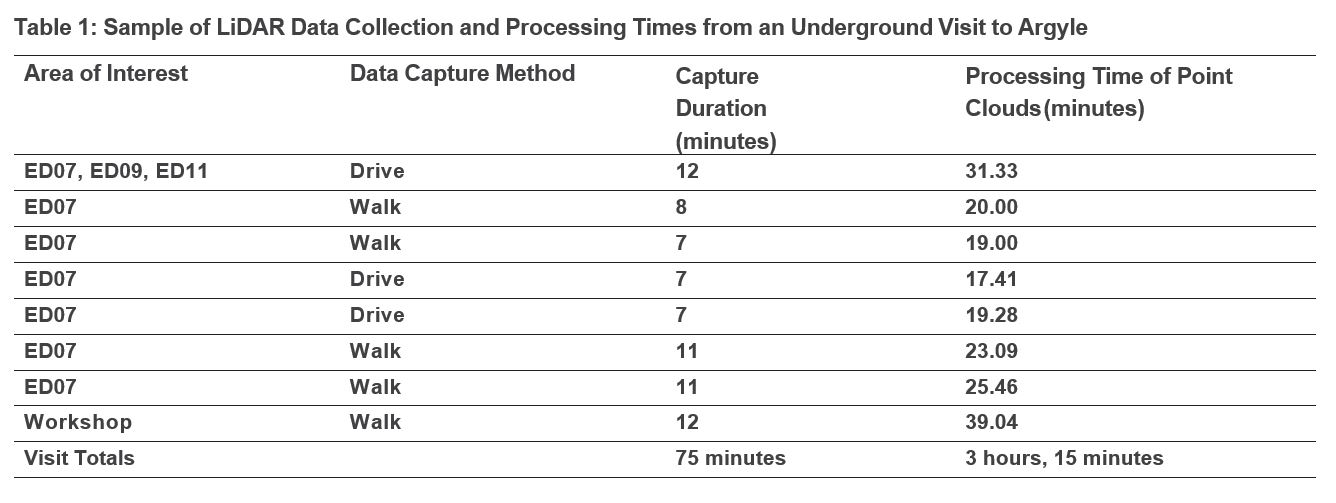
Also deployed during both site visits, the Hovermap LiDAR mapping system covered broad areas of each development drive (backs and walls) and was used to generate convergence datasets. Hovermap data collection was achieved through a combination of walking and vehicle-mounted scanning methods. A sample of times for data capture and processes on one underground visit can be found in Table 1.
- Extraction drives 200 m to 250 m in length were vehicle-scanned in 7 to 8 minutes
- Collecting the data by walking LiDAR scanning took approximately 11 to 12 minutes per 200 to 250 m drive
- As the area to scan increases, the relative scan time per 100 m decreases
- Where parallel drives are scanned, data collection can be stopped and started without powering down the Hovermap unit
- Exporting the data into a point cloud takes approximately 2 to 3 times the capture time, resulting in an average of 5 minutes for a 100 m drive scan (recent Hovermap software upgrades have further reduced these processing times). Additional time can be saved by processing the data underground immediately, if practicable, so the data is available once at the surface.
Hovermap data processing
The resultant point clouds were created using the Emesent post-processing software. Displacement analysis to measure convergence was subsequently performed using open source software, CloudCompare. This workflow required 20 minutes for point cloud creation and 60 minutes for displacement analysis. Stating the precision of LiDAR displacement to two decimal places is noted to exceed the accuracy of the process. However, to compare the measurements to the tape extensometer data, two decimal places have been used.
Extraction of convergence from point clouds
Two Hovermap scans, captured a month apart, were used to produce two point clouds for each drive. Initial alignment of the point clouds was completed manually, as the data was not georeferenced. A fine registration was subsequently completed using CloudCompare. The distance between the first and second point clouds was calculated and used to generate a heat map of displacement of the walls and backs.
The intensity scale in LiDAR data allows many features to be identified, such as rock bolts, paint and water inflow. Painted circles around the convergence pins were used to isolate each pin in the point cloud.
The distances between the two point clouds are provided as scalar values. They were calculated using the following method:
- The points within the painted circles were extracted for each wall
- The distance between the point clouds was averaged for each wall
- The distances for each wall were summed to provide a total convergence value representing the equivalent tape extensometer value.
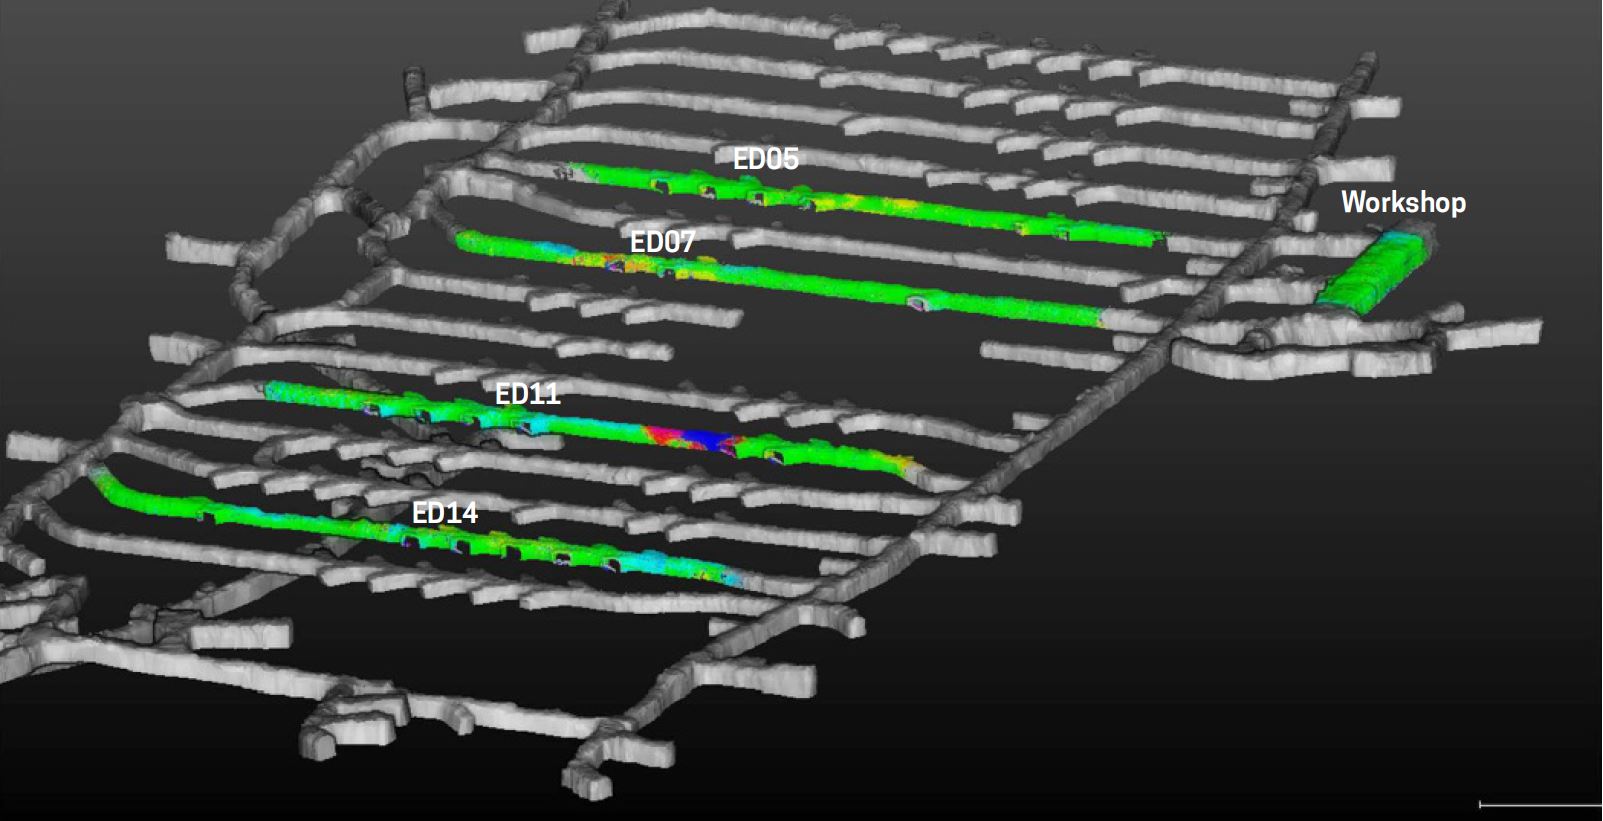
Coverage
Four extraction drives were scanned during each visit (ED05, 07, 11 and 14), at a depth of approximately 400 m below the surface (Figure 2).
However, the results from only one drive (ED07), and from the workshop, were used to directly compare tape extensometer convergence results.
Repeatability
To assess LiDAR repeatability, the convergence analysis process was applied to two scans completed on the same day. The two scans aligned well, except at one drawpoint, which recorded 10 mm negative movement. See Figure 3.
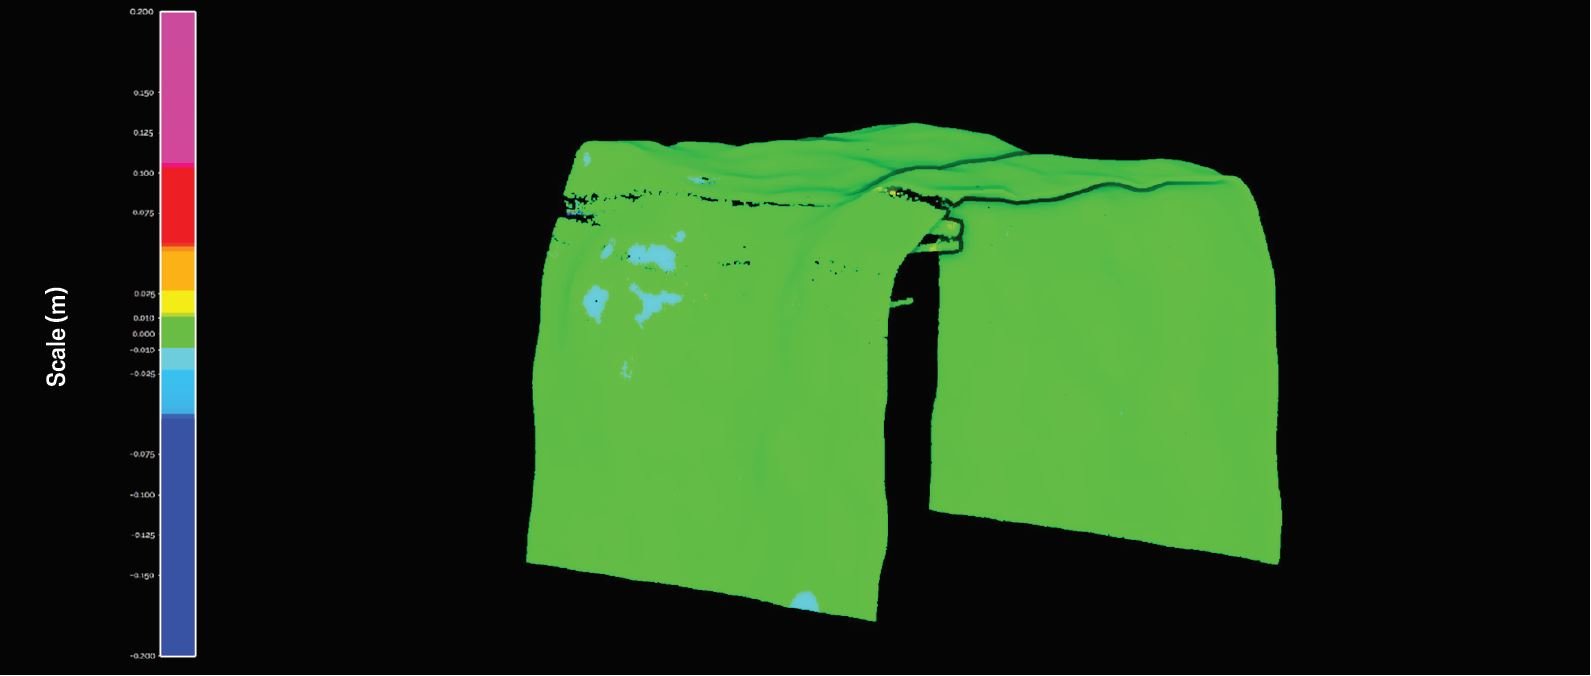
Validation in area with no expected movement
To further validate the accuracy of the LiDAR point cloud data, convergence was measured in an area where little to no movement was expected. The underground workshop was considered a suitable area of interest and the resultant point cloud is shown in Figure 9 (see below).
Results
Point cloud convergence was calculated relative to the tunnel surface, which may not be in the direction of the tape extensometer. While the convergence measurements do not represent a direct comparison, using the methodology discussed provides a representative comparison for the purpose of validating the methodology.
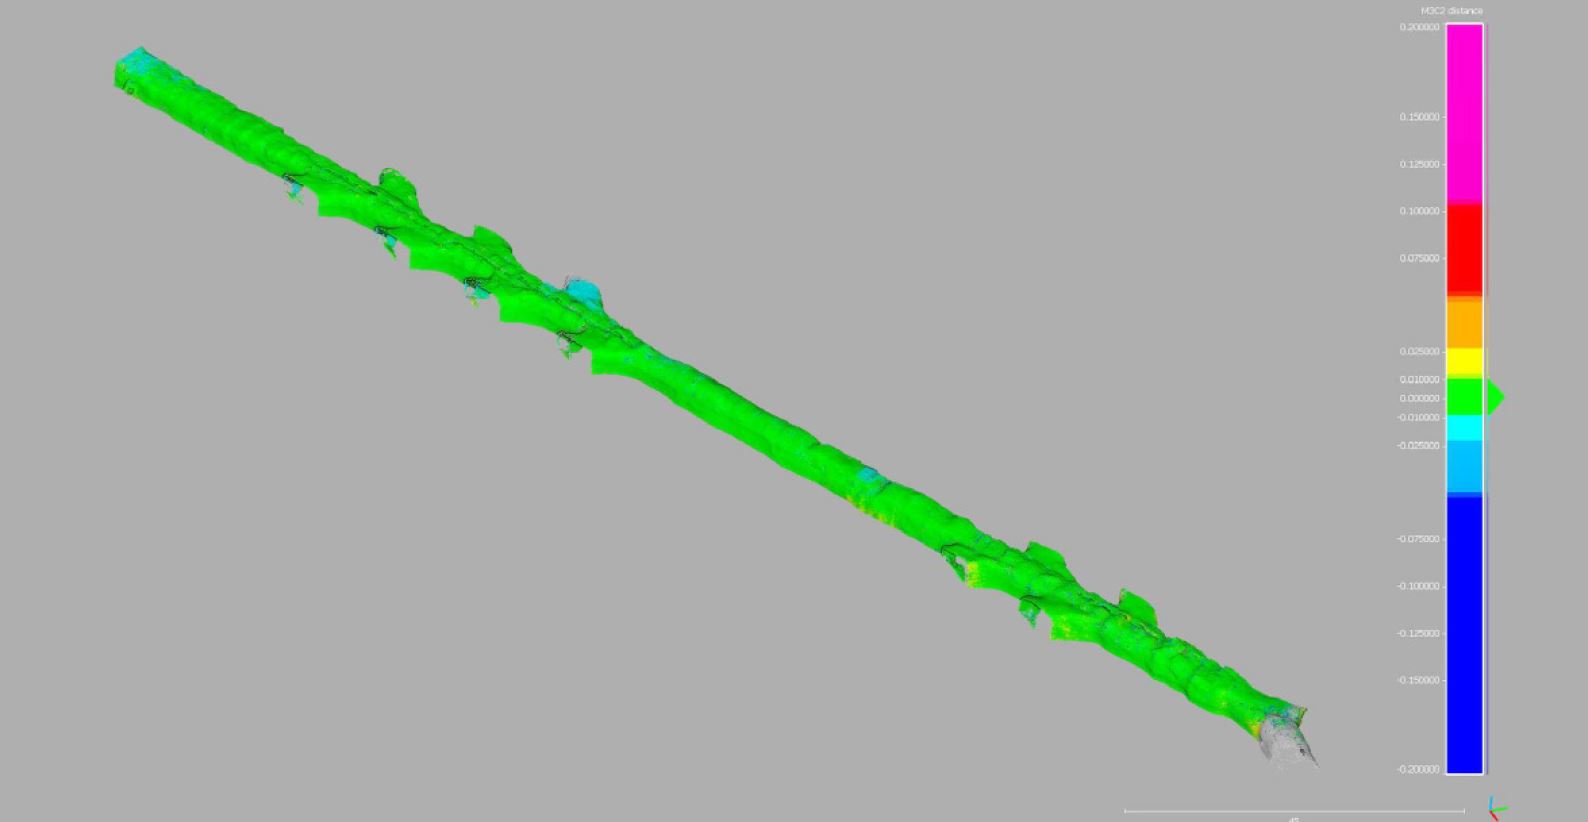
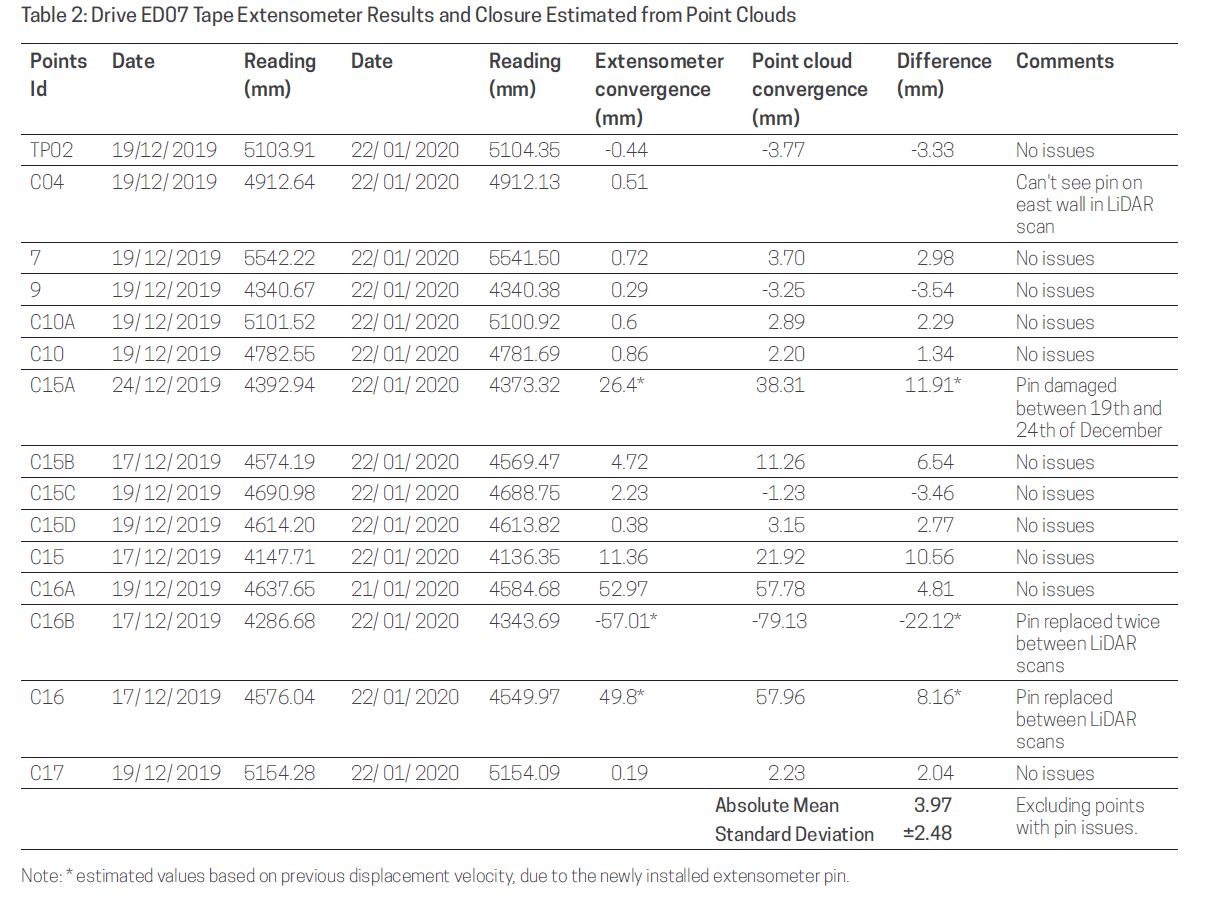
Convergence for the full length of Drive ED07
In the comparison of LiDAR convergence with extensometer measurements, three extensometer stations had issues due to pin damage and replacement (see the comments in Table 2).
Excluding the results with noted issues, the difference between the tape extensometer data and the point cloud measured convergence is 3.97 mm ±2.48 mm (Absolute Mean & Standard Deviation).
Comparison of extensometer and lidar using 2 m slices
One of the major advantages of using point clouds for displacement measurement is the superior areal coverage provided by the method. To compare it with the extensometer method, 2 m point cloud sections (1 m either side of the tape extensometer pins) were used to assess the overall displacement of the area against the measured tape extensometer values. Five 2 m sections are shown in Figures 4 - 8.
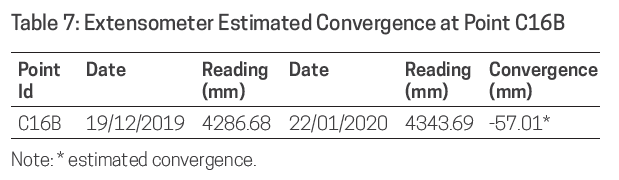
A color scale was used to visualise movement along the normal from the centroid:
- Green – displacement is less than ± 10 mm
- Yellow/Ice Blue – displacement is ± 10 to ± 25 mm
- Orange/Light Blue – displacement is ± 25 to ± 50 mm
- Red-Pink/Blue – displacement is greater than ± 50 mm
Positive values (warm colors) represent closure of the tunnel, whereas negative values (cold colors) indicate an expansion or an increase in available space within ED07.
The tape extensometer data requires an assumption that convergence is uniform and perpendicular to the measurement axis.
By comparison, LiDAR scanning enables the history of convergence for the back, walls and shoulder to be recorded and monitored across intervals. Any stripping of the wall on one side of the drive, the continued closure of the shoulder, or convergence around the stripped area is recorded and accurately monitored.
Point TP02
During the measurement timeframe, a change of less than 1 mm was measured using the tape extensometer.
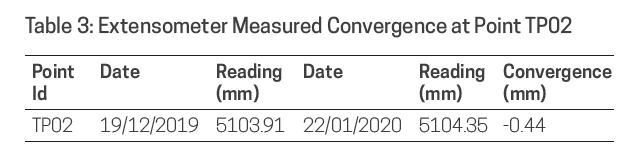
The point cloud analysis identified no notable movement, which is consistent with the extensometer reading.
Point C04
Contraction of less than 1 mm was measured using the tape
extensometer.

Even though one of the convergence pin locations could not be clearly defined in the LiDAR scan, there was no notable movement in the point cloud (Figure 5).
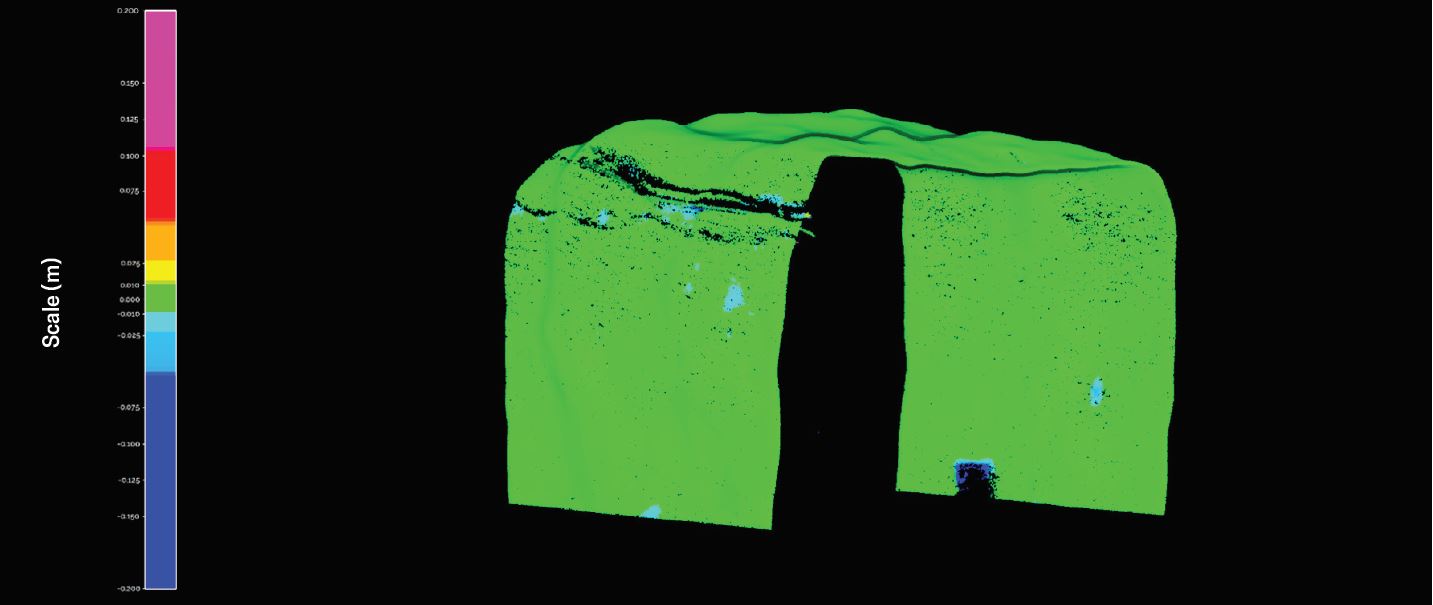
Point C16
Drift convergence greater than 20 mm was measured using the tape extensometer. Direct comparison was complicated by the fact that the pins at point C16 were replaced between the two LiDAR scans.
When measuring the difference between readings (using the average velocity to interpolate the missing days) this station was estimated to have converged by approximately 50 mm.
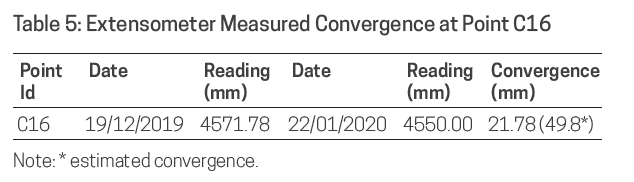
When comparing the result of the tape extensometer with the point cloud data, the measurement pins are shown in an area of yellow on the left wall and in orange on the right wall (Figure 6). Areas of higher displacement (pink > 50 mm) in close proximity that were not captured in the tape extensometer data can be easily observed.
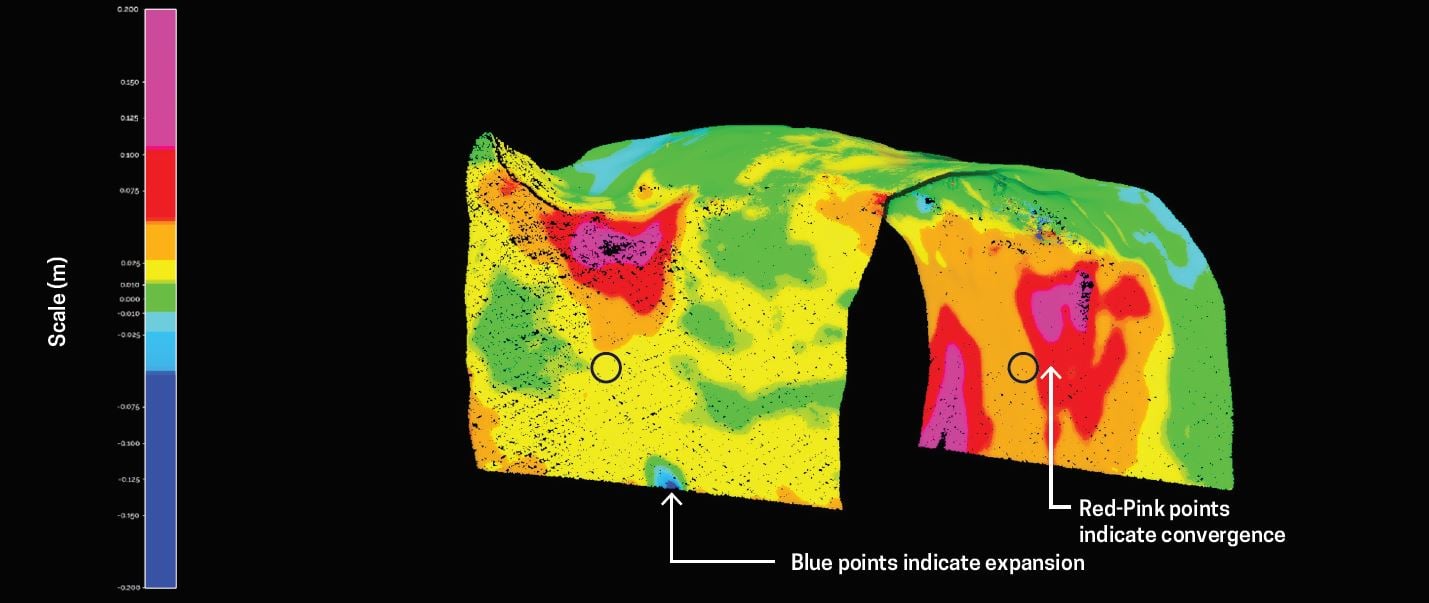
Point C16A
Convergence greater than 50 mm was measured by the tape extensometer.
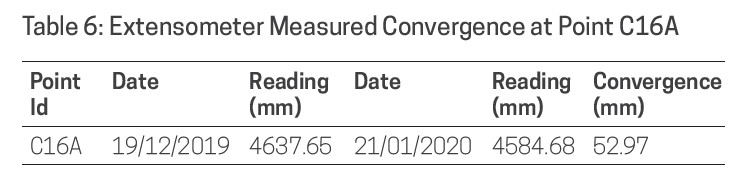
Convergence is clearly evident in the point cloud where both sides of the drive show closure. The areas adjacent to the measurement pins are shown in orange (> 25 mm) on the left wall and yellow (10 – 25 mm) on the right wall (Figure 7).
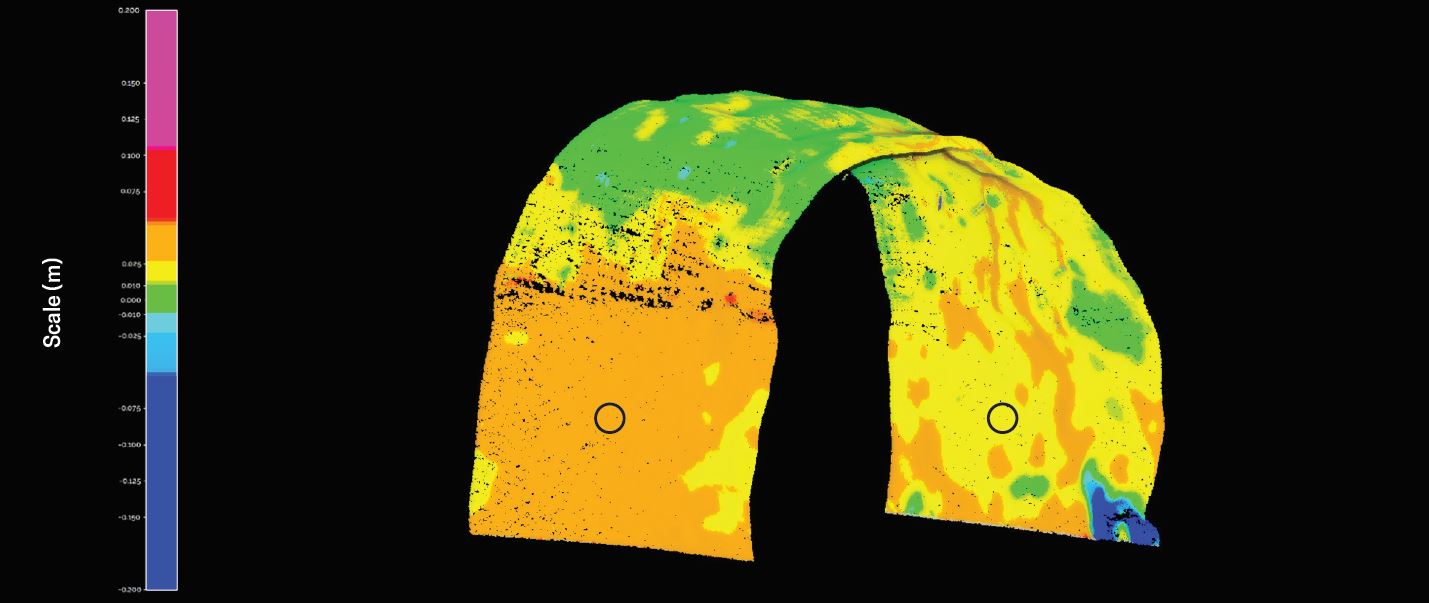
Point C16B
Expansion of 57 mm was estimated, based on established closure rates.
Negative displacement is shown (Figure 8) in the point cloud data, with one wall indicating stripping, areas of blue. Additionally, closure on the other wall can be seen.
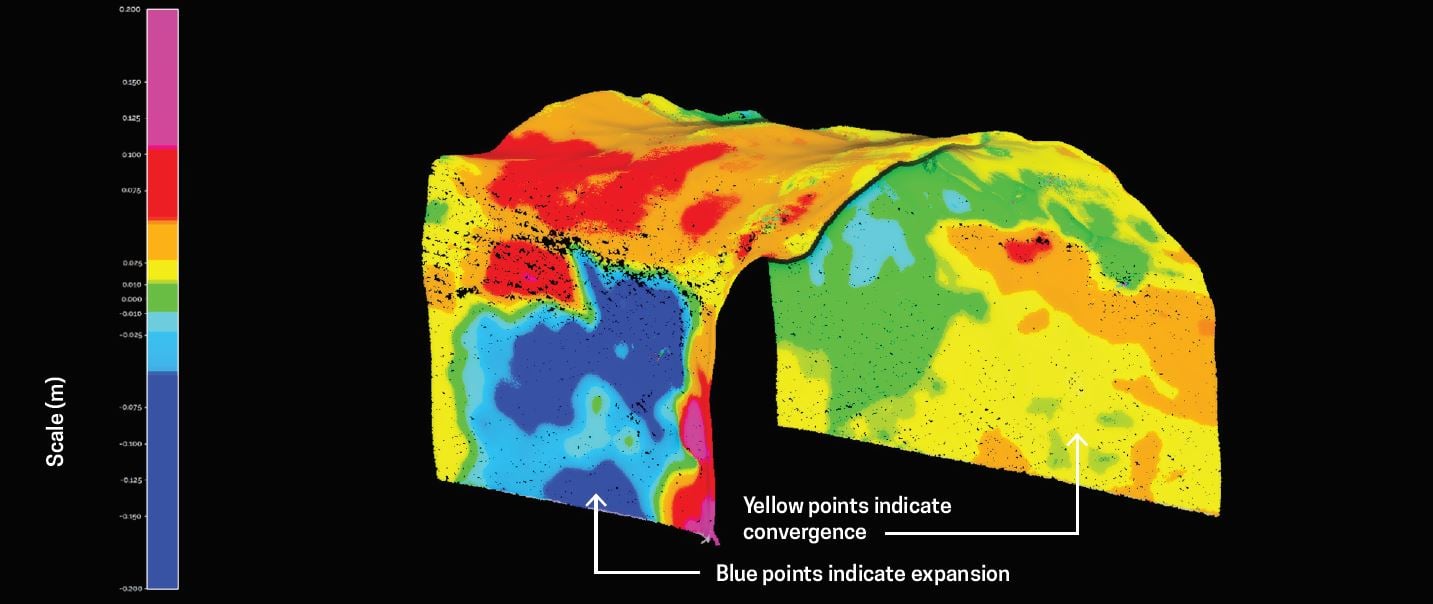
Workshop
The convergence analysis of the workshop returned no notable movement during the measurement period, as shown in Figure 9.
Observations in other drives
Additional observations can be made in association with the data collected during the site visit at Argyle.
Evidence of closure likely associated with Gap Fault is observed in ED5 (Figure 10) along with closure in areas associated with high backs.
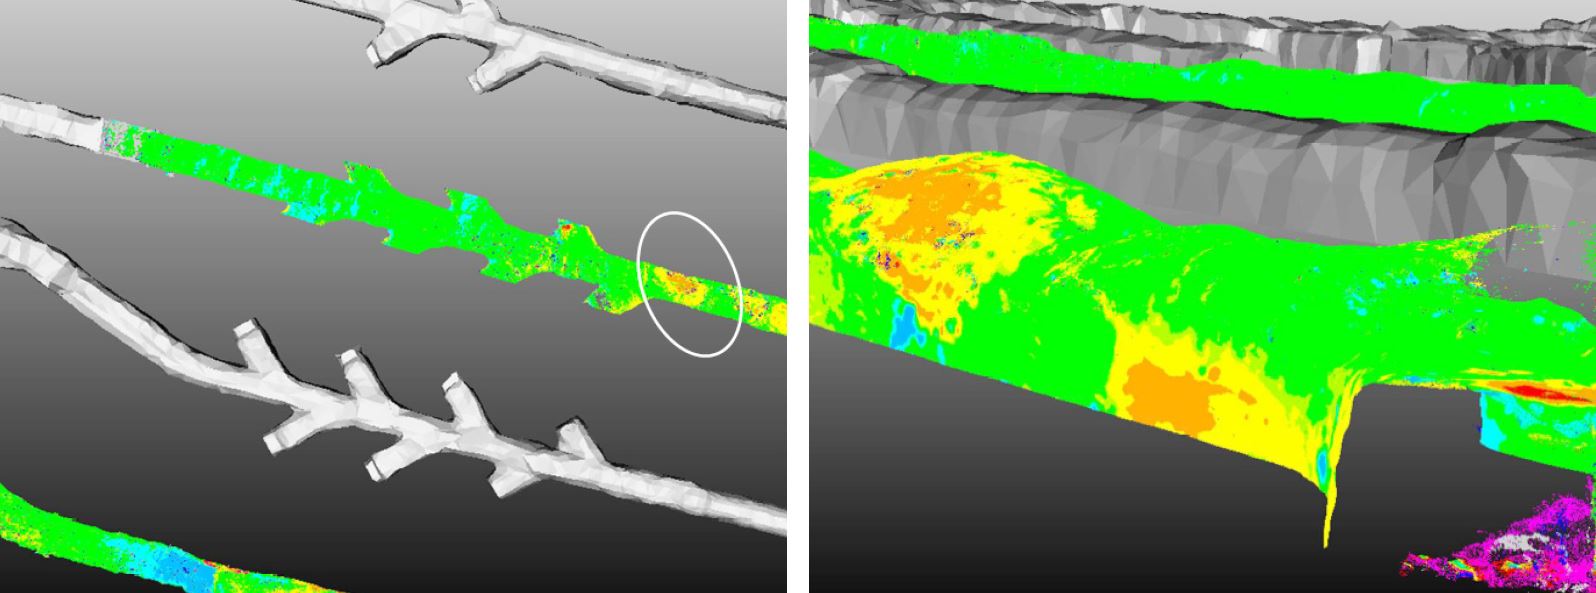
In areas adjacent to a drawpoint, additional closure was present on the side walls. This side wall closure may have been detected during routine convergence measurements, using the extensometer method, but the closure in the backs would have been missed.
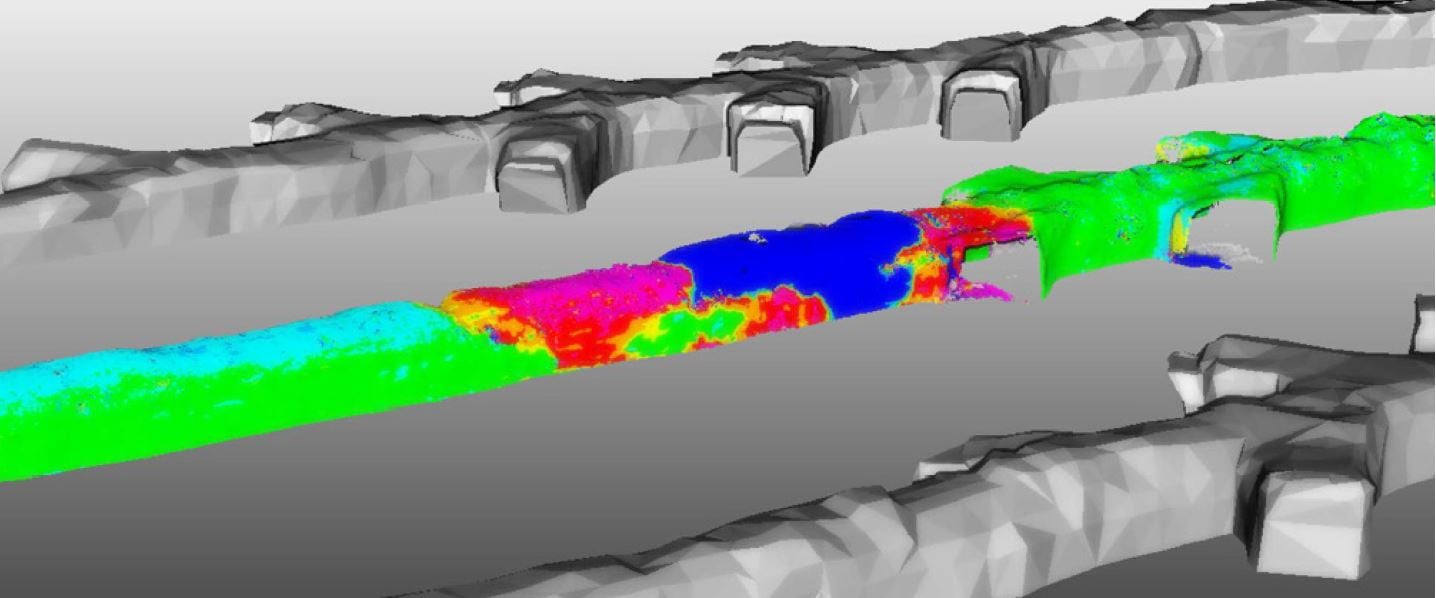
In ED11 (Figure 11), point cloud data reveals areas of expansion (blue) which appear to be stripping the backs. Areas immediately adjacent show high convergence (pink). This increased convergence may be partially associated with the stripping but is likely to represent a continuation of drive convergence, and could be used as a gauge for the likely extent of drive rehabilitation.
Conclusion
The trial of Emesent’s SLAM-based LiDAR mapping system, Hovermap, at Rio Tinto’s Argyle Diamond Mine for displacement monitoring was conducted across December 2019 and January 2020 by MINELiDAR.
The exercise demonstrated that Hovermap LiDAR data capture could be completed quickly (200 m extraction drives were scanned in 7 minutes) with greatly reduced risk to personnel.
MINELiDAR estimated a 75% reduction in underground exposure for Rio Tinto personnel and contractors because personnel are required for less time on the extraction level due to faster, cost-effective vehicle-based data collection.
The resultant point cloud data could be processed and integrated into mine CAD software and accessible to engineering, geotech, geology, and survey teams in around 30 minutes, providing a high level of detail across multiple departments. This does not include the convergence processing time.
Point cloud data was shown to offer superior areal coverage and the ability to identify movement direction and orientation.
The Hovermap LiDAR point cloud versus tape extensometer absolute mean variance was less than 4 mm. This indicates the point cloud method is sufficiently accurate for displacement monitoring.
LiDAR data can be represented in mine space as either point clouds or wireframes. Fault and lithology wireframes, production data and drill hole data can be visualised in conjunction with this point cloud convergence data in any mine visualization process.
The comprehensive and accurate convergence data delivered by Hovermap provides a basis for improved decision-making and remediation planning at underground sites.