
Opinion: Where are we in the cycle?
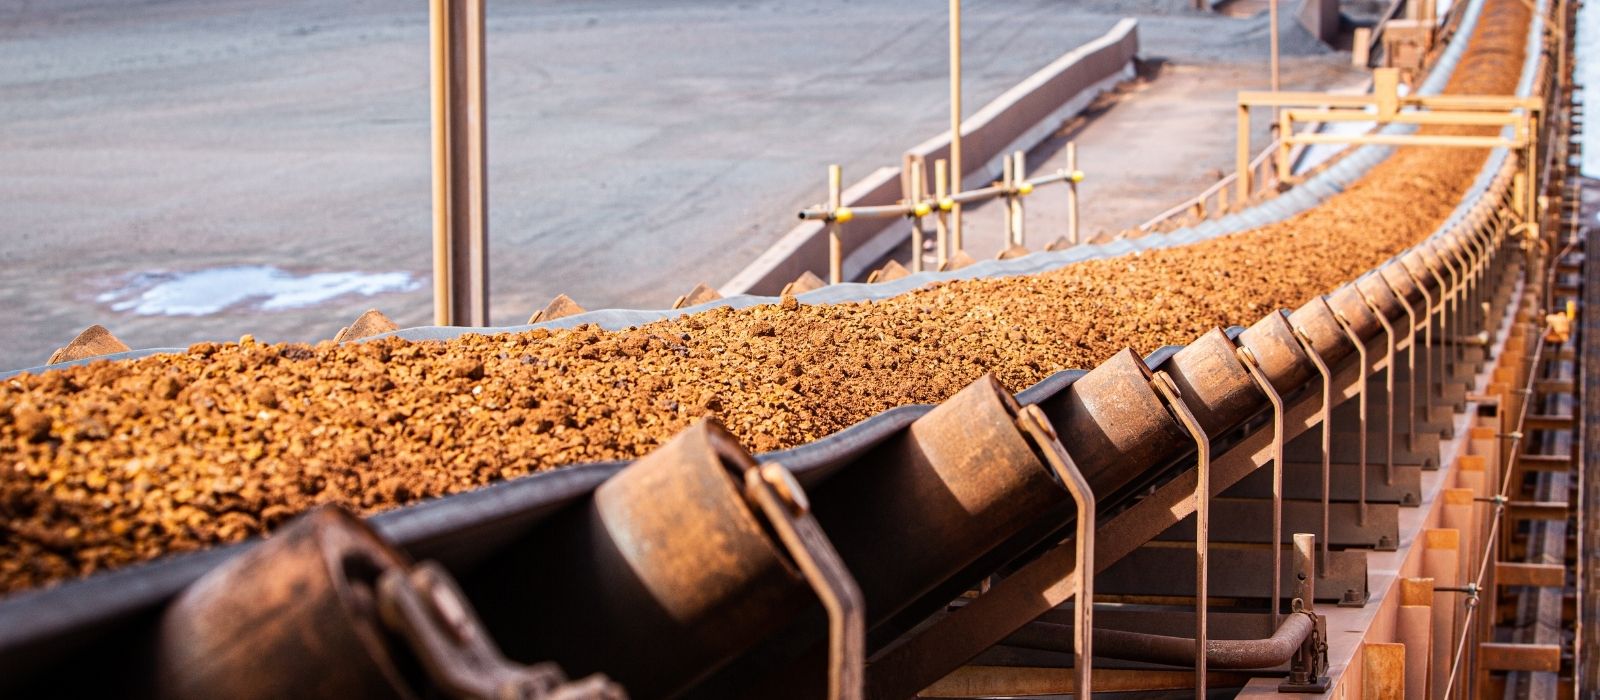
An in-depth look at metals markets to better understand the current environment, using a framework of colour-coded guideposts: one is ‘green’, three are flashing ‘amber’ and one has turned ‘red’ – pointing to a metal price cycle approaching a peak and at rising risk of moving into a downswing phase.
Introduction and background
Taken together, the six principal London Metal Exchange (LME) metals – aluminium, copper, lead, nickel, tin and zinc – have undergone 12 cycles over the past 60 years. The average peak-to-peak duration of these cycles has been 63 months. The average peak-to-trough has been 31 months.
As a group, prices of the six LME metals have doubled since the time of the last cyclical low point in April 2020. The prior cyclical peak was 24 months ago.
Using a framework to track movement
To be useful, a framework designed to track the direction of prices should have four characteristics:
- a sound theoretical basis for the explanation of price movements across multiple cycles
- a focus on a small number of proxy variables to avoid the ‘noise’ associated with busy capital markets
- selected indicators based on objective and regularly reported measures, as far as possible, and not opinions or forecasts
- the capacity, after the event, to track errors, permitting some understanding of where misjudgements might have occurred.
The five selected proxy indicators cited here are based on the idea that metal prices are fundamentally driven within an inventory adjustment model. In such a model, unanticipated changes in demand or supply produce the shifts in inventories, which drive prices. Within that context, policy swings forcing changes in the momentum of economic activity are a key ingredient in cycle formation.
Because metal prices are usually quoted in US dollars, exchange rate movements also play a role in shaping the trajectory of reported prices.
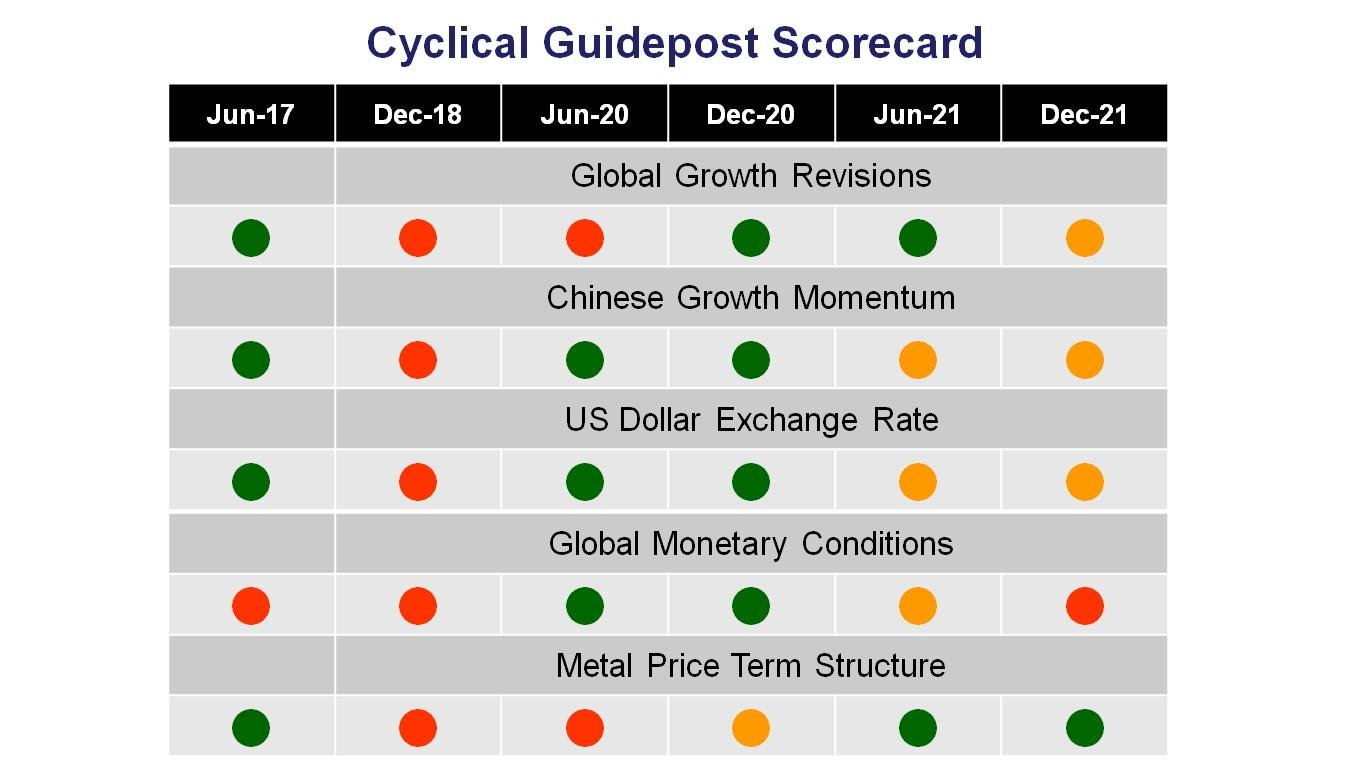
In the cyclical guidepost scorecard described in this article, each of the indicators is categorised as ‘green’, ‘red’ or ‘amber’ to signal whether it is consistent with an upward move in prices, a cyclical downswing, or a transition between these two conditions.
Global growth
Economists at the International Monetary Fund (IMF) review their global economic growth forecasts four or five times a year, providing a regular flow of forecast adjustments.
The frequency and size of global growth revisions, rather than recorded or expected rates of growth, indicate whether judgements about the growth path are changing and possibly impacting market balances unexpectedly.
In early 2020, growth expectations were cut savagely as the COVID-19 pandemic battered economies everywhere. Surprisingly, by the end of 2020, forecasts were being raised rapidly as earlier expectations of economic recovery had proven too pessimistic.
The tendency for forecast upgrades for 2021 due to revised 2020 base effects concealed a tendency for weakening underlying growth through the course of 2021 and into 2022.
Now, the impact of the central bank liquidity surge and accompanying fiscal compensation for the effects of government lockdown mandates is lessening. Sluggish pre-pandemic growth drivers are resuming their primary roles.
In January, the IMF released a set of interim forecast revisions pending its regular April forecast round. Worried about the ongoing effects of COVID-19 induced business closures, the IMF downgraded global growth for 2022 from 4.9 to 4.4 per cent.
With the pattern of global economic growth revisions shifting, the global growth guidepost is flashing ‘amber’ with the risk of moving to ‘red’ in the near term as expectations adjust further to the downside.
Chinese momentum
Medium-term Chinese growth variations feed into the IMF forecasts. China’s monthly purchasing managers index, typically released by officials on the first day of each month, offers a near-term insight into changes in the momentum of manufacturing activity in the country accounting for around half of global metal use.
The Chinese short-term growth momentum indicator turned ‘green’ in June 2020, after China quickly corralled the COVID-19 virus and returned to growth. Nonetheless, the momentum started to slacken noticeably through the middle of 2021 before edging up only slightly over the last two months.
Chinese growth momentum has been categorised as ‘amber’.
US dollar
The US Federal Reserve publishes an index of US dollar exchange rates each day weighted by amounts of trade between the USA and other advanced countries.
The downward trajectory of the US dollar over the past 50 years has been interrupted occasionally by periods of strong appreciation that have usually been subsequently reversed.
Periods of US dollar strength have coincided with weakness in US dollar metal prices. US dollar weakness has been matched by metal price strength.
Contrary to the longer-term trend, the US dollar has remained unusually elevated for the past several years. The downward directional shift which occurred through the latter part of 2020, as optimism grew about the attractiveness of non-US dollar investments, has been reversed in the past year.
As investors have sought US financial assets amidst evidence of relatively attractive financial returns connected to a US economic resurgence, the dollar has been strengthening.
A stronger dollar is a drag on US dollar denominated commodity prices. To take account of the slackening pace of currency appreciation, the US dollar has been given an ‘amber’ rating.
Monetary settings
Growth in money supply, published monthly by the OECD and US Federal Reserve, is the selected proxy for the international policy stance.
There had been overwhelming evidence, well before the present cycle, of the role of central banks in metal markets. Tightening monetary conditions have typically brought an end to an upswing in metal prices.
While money supply growth was unprecedentedly strong through much of 2020 and 2021, the growth rate has decelerated just as dramatically, particularly after adjusting for inflation, leading to changes from ‘green’ to ‘amber’ to ‘red’ in the traffic lights for this indicator.
Metal price term structure
The metal price term structure for the six LME metals is partly a proxy for speculative interest but also a measure of market anxiety about the near-term availability of metal.
A backwardation would indicate near-term shortages and heightened concerns within the market about supply adequacy, adding to the upward cyclical impetus.
The metal price term structure has been signalling underlying tightening in market conditions in recent months although metal shortages are isolated and relatively moderate for such an apparently powerful cycle.
Although supplies have been constrained by the global pandemic, demand growth had been unusually slow for several years before the pandemic began. The risks of shortages are not especially high because the cycle has not been demand driven. Nonetheless, the current market positioning warrants a ‘green’ signal.
The cyclical evolution
A mid-2017 cyclical upswing had turned strongly negative by the end of 2018.
A down cycle was well and truly underway through 2019 and before the onset of the pandemic.
Conditions improved quickly through the second half of 2020. By the end of the year, the negative pandemic effects on the market had largely run their course and the indicators were pointing to the strong cyclical conditions which have persisted through most of 2021.
Several warning signals had started to emerge by the middle of 2021.
And, presently, we can see the first genuinely negative influences emerge as favourable monetary conditions dissipate.