
Using mobile LiDAR to improve underground geology mapping
Underground geological mapping traditionally consists of 2D photos and hand drawn face mapping sketches, while photogrammetry and 3D modelling are also employed at some mines. This article explores how Aeris Resources evaluated the utility of mobile LiDAR mapping to capture and accurately model ore drive faces and backs.
Mobile LIDAR (light detection and ranging) mapping has typically been used by survey in underground mines to capture data for geotechnical and engineering applications. Increasing numbers of mines use technologies like the Emesent Hovermap to autonomously capture high resolution data of stopes, drives, raises, and retired areas. Using it for face mapping hadn’t been tested until Aeris Resources’ Cracow mine evaluated the practicality, efficacy and potential value of workflows under typical operating conditions.
Innovation in underground geological mapping
Aeris Resources’ Cracow gold mine wanted to evaluate new technologies that could improve its grade control processes. One challenge was to produce spatially accurate, registered polyline data of ore veins present in ore drive face and backs.
Their current 2D method requires geologists to wash, photograph and manually map the face and backs of an ore drive. These time-consuming tasks produce data that may be inaccurate because lithology and structural features are not interpreted consistently.
The mine Resource geologists sought a new method that improved the data quality and accuracy of vein wireframes in the resource model, which in turn would improve directional control on development and stope design to maximise ore recovery.
In December 2021, they had an opportunity to evaluate LiDAR scanning when University of Queensland Geology Honours student Jane Gray approached Brad Cox, Aeris’ General Manager Geology. Her project was to determine whether colourised LiDAR could improve underground face mapping procedures using the Emesent Hovermap SLAM-based LiDAR sensor. Hovermap was selected because it is widely used in underground mines to capture high resolution geotechnical and engineering data, supports colourised LiDAR, is light weight and easy to use.
Geology at Cracow
Located 600 km northwest of Brisbane, the Cracow Gold Mine deposits are hosted in andesite, a dark-coloured volcanic rock. Gold mineralisation is found in steeply dipping white quartz/carbonate veins and stockwork.
Cracow’s white mineralised veins hosted in dark country rock presented an ideal target to trial colourised LiDAR imaging.
Problem: mapping drive backs – moving from 2D to 3D
A modern mining company, Aeris Resources seeks innovate new ways that improve performance and sustainability in its mining operations.
With numerous exploration and underground expansion projects underway, the Cracow team knew they needed a better method to map the structural and geological features of underground development and production areas.
The existing grade control process requires a geologist to take several photographs and hand-sketch the ore domains, structural features and lithology by hand onto a paper face-mapping sheet. These details are then interpreted back in the office and used to update the geological wireframes.
But mapping the ore veins along the backs of the development drive was a time consuming and repetitive task, involving some subjectivity in the interpretation. With low quality photos and inconsistent mapping standards this meant that the face and backs mapping data is not routinely used. The significant time and effort required to capture the data is not transferred to usable data (knowledge).
For complex areas the Resource geologist will either re-evaluate the photos or re-map the drive with survey support to get accurate wireframe models — taking up even more time.
These repetitive, manual processes were consuming valuable geology resources but not producing accurate vein wireframes for the geological model.
Trial 1: To colour or not: testing colourised LiDAR and intensity
In December 2021, the face and backs of four ore drives were scanned using the Emesent Hovermap scanner with a GoPro and LED lighting rig attached, Figure 1. The resultant 3D point clouds were processed to add RGB colour. Using Emesent processing software and CloudCompare, the trial evaluated:
- time to scan the face, backs and survey points in ore drives
- time and procedure to produce colourised RGB point clouds
- resolution and feature clarity of RGB and intensity point clouds, compared to original face photos.
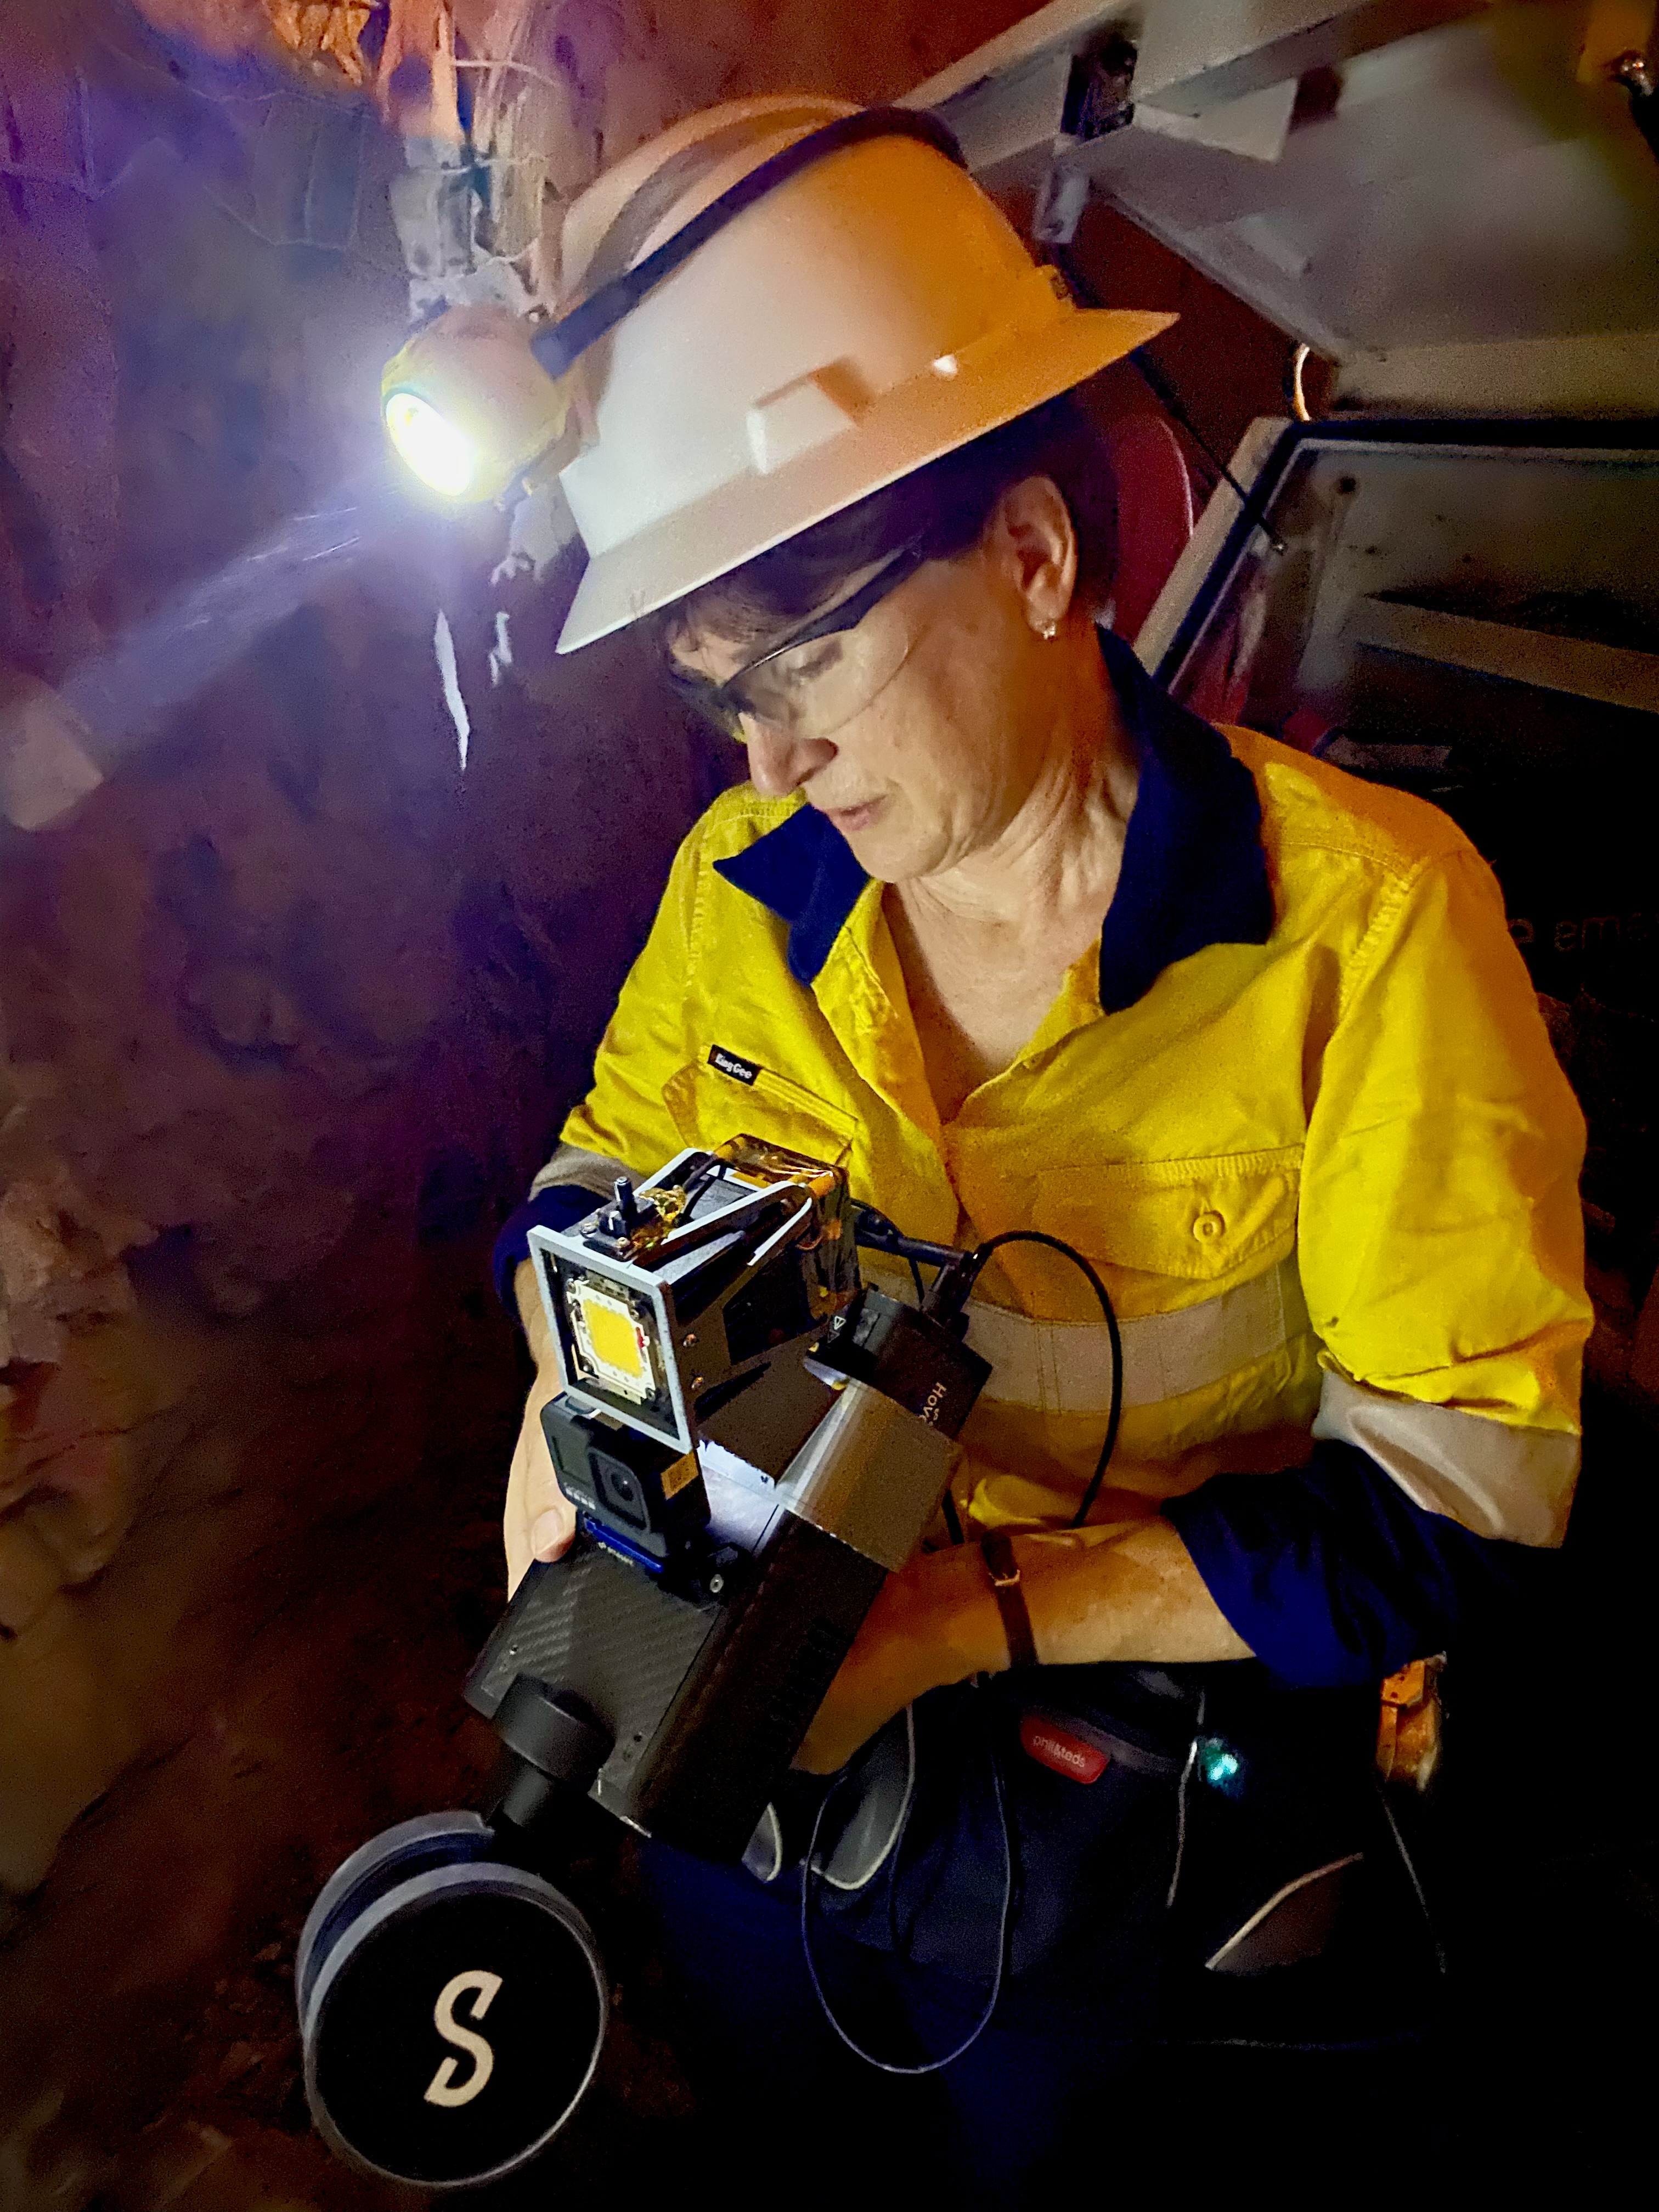
Figure 1. Handheld Hovermap configuration with camera and light.
Results
White mineralised veins are easily visualised in colour point clouds as well as those coloured using the intensity, an attribute that represents the strength of the LiDAR return (eg, white quartz rock is more reflective than the dark andesite). Figure 2 compares a face photo with point clouds coloured with RGB colour and intensity.
Interestingly, while RGB colour provided additional detail, the longer two-step process for colourisation is difficult to justify when the false colour (intensity) is sufficient to accomplish the task.
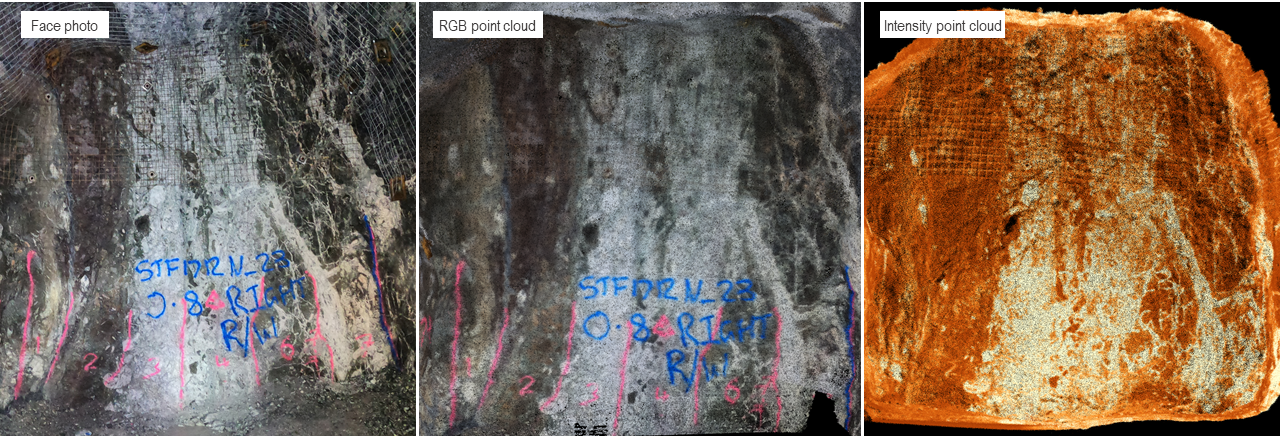
Figure 2. Comparison of a photo and colourised point clouds. Spatially accurate details of veins are visualised in RGB- and intensity-coloured point clouds.
This was confirmed by site geologists who indicated that intensity provided sufficient detail to trace vein hanging wall (HW) and footwall (FW) contacts, and that processing to colour was not required.
Average Hovermap scanning and processing times for colour
|
Scan time (avg mins) |
Process to 3D point cloud |
Process to add colour |
Visualise in CC |
Total time per scan |
|
3 mins |
6 mins |
22 mins |
5 mins |
36 mins |
The next step was to demonstrate a workflow that incorporated tracing HW and FW contacts in the face and backs of ore drives, registering the scans to mine coordinates and importing contacts into Maptek Vulcan.
Trial 2: Intensity wins – face and backs 3D mapping workflow
In March 2022, a second trial scanned three ore drives and faces to evaluate a workflow that included:
- scanning development drives, faces and control points
- processing to 3D point cloud
- registering the scans to mine survey coordinates
- visualising, tracing polylines along ore veins
- saving as georeferenced HW and FW strings for import into Maptek Vulcan.
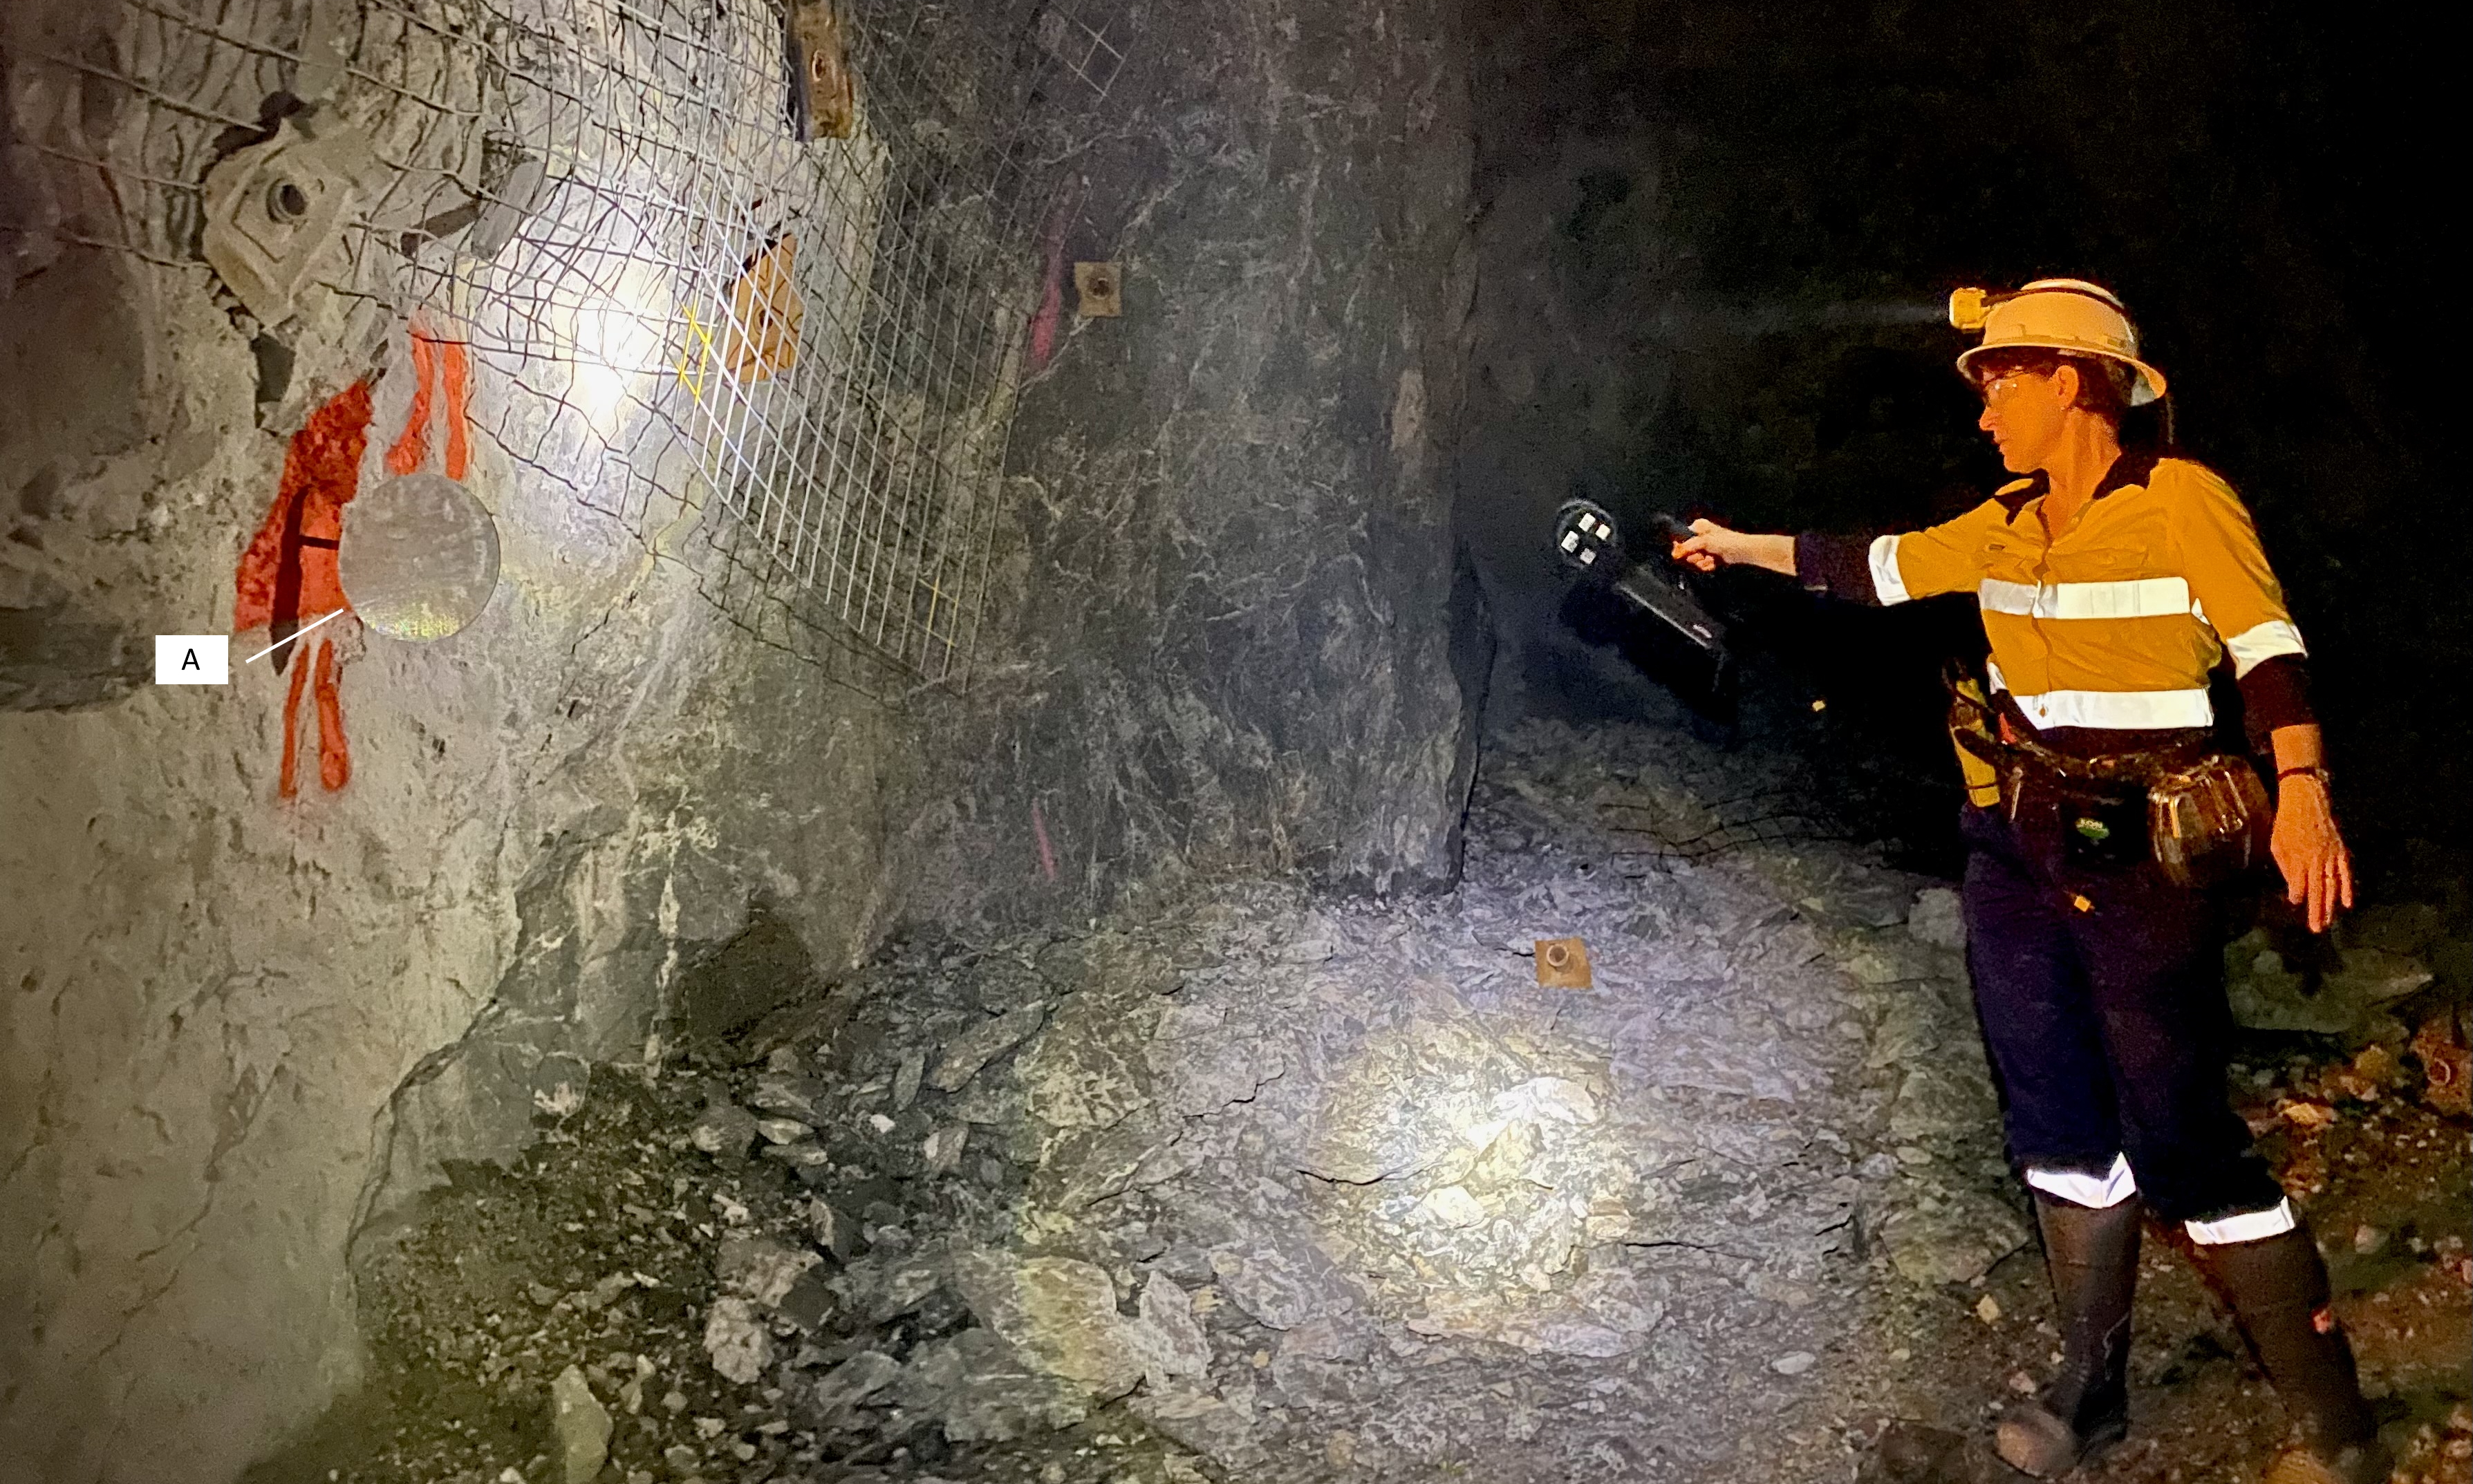
Figure 3: Scanning an Emesent GCP target (A) to register the point cloud to the mine coordinate system.
Georeferencing was achieved by inserting three Emesent ground control point (GCP) targets into existing survey stations along the drive. These were captured as part of scanning the drive face and backs, illustrated in Figure 3. The Hovermap data was processed to point cloud and automatically registered to the mine model using surveyor-supplied coordinates within the Emesent software. CloudCompare was then used to visualise the point clouds, using the intensity attribute, trace the HW and FW contacts and export georeferenced string files.
To assess the impact of dust on scan quality, and test georeferencing repeatability, a 20-m section of drive backs was washed and then scanned. This same drive was scanned two days later with only the most recent cut face and backs washed.
Results
Scans were easily registered to mine coordinates during processing using the Emesent software. Walking along the drive to insert and scan targets added only a few minutes to the overall scan time.
Once visualised using the intensity attribute in CloudCompare, the main and stringer veins were clearly visible and, using the polyline tool, traced along the backs and face. The georeferenced polylines were saved as .dxf files for import into the resource model in Vulcan. Multiple georeferenced scans (see Scans #1 and #2 in Figure 4) were easily dropped into CloudCompare and aligned without any additional adjustments. The second scan (red) was clipped to use the most recent face cut, the only part of the drive that was washed.
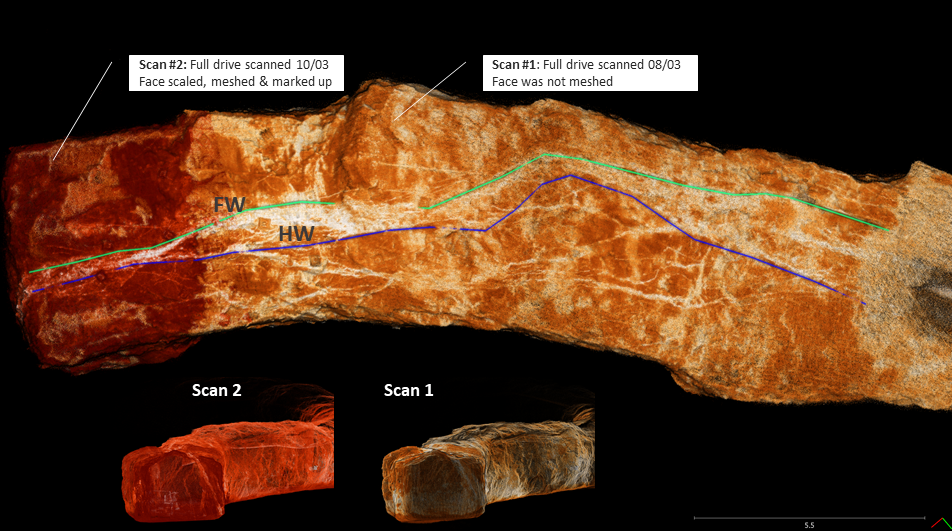
Figure 4: Two drive scans aligned in CloudCompare (CC) with polylines traced along the HW and FW contacts.
The average times for each step of the workflow are listed below.
Average time for each step to map face and backs
|
Scan time (mins) |
Process 3D georeferenced point cloud |
Visualise in CC |
Trace polylines in CC |
Total time per scan |
|
5 mins |
10 mins |
2 mins |
8 mins |
25 mins |
Dust affected scan quality. Where dust was present on the drive surface, such as in unwashed sections, ore veins were difficult to identify and trace.
Conclusion: Mobile LiDAR makes the grade
The two trials showed that a mobile LiDAR sensor, such as the Emesent Hovermap, easily and quickly scans development drives, and produces accurate 3D georeferenced point clouds that enable ore contacts to be traced using polylines. These outputs, once imported into a geology model, accurately inform ore body wireframes. This workflow has the potential to deliver a range of benefits to geology, as outlined below:
- reduced exposure time for geologists who previously manually mapped drive backs
- accurate ore body data to inform wireframing along ore development drives
- high resolution point clouds that enable the identification of structural features
- accurate, registered as-builts, volumes and reconciliation of ore drives.
Going forward
There is, of course, more work needed to fully embed this workflow into the daily grade control procedures at an underground mine. Also, even though using intensity works at Cracow, an epithermal deposit with mineralisation in white veins, sulphide deposits (with “shades of grey” rock) may not find this method suitable.
Acknowledgements: Thank you to the geology team at Cracow for sharing their time and knowledge, Aeris Resources’ General Manager Geology Brad Cox for his support, my supervisors, Carlos Spier and Jeremy Sofonia, and Emesent for the use of Hovermap and the lighting rig.